
Metrics Bar Chart App
How to use the Metrics Bar Chart app
What is the Metrics Bar Chart App?
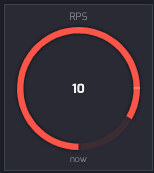
The Metrics Bar Chart app allows you to take metrics data and arrange it into a bar chart on your playlist.
The bar chart uses the Table Metric Type and displays arrays of keys, value pairs in a horizontal bar chart:
Adding the Metrics Bar Chart App
To get started with the Metrics Bar Chart App, follow these simple steps:
- From the lefthand taskbar navigate to the Apps tab.
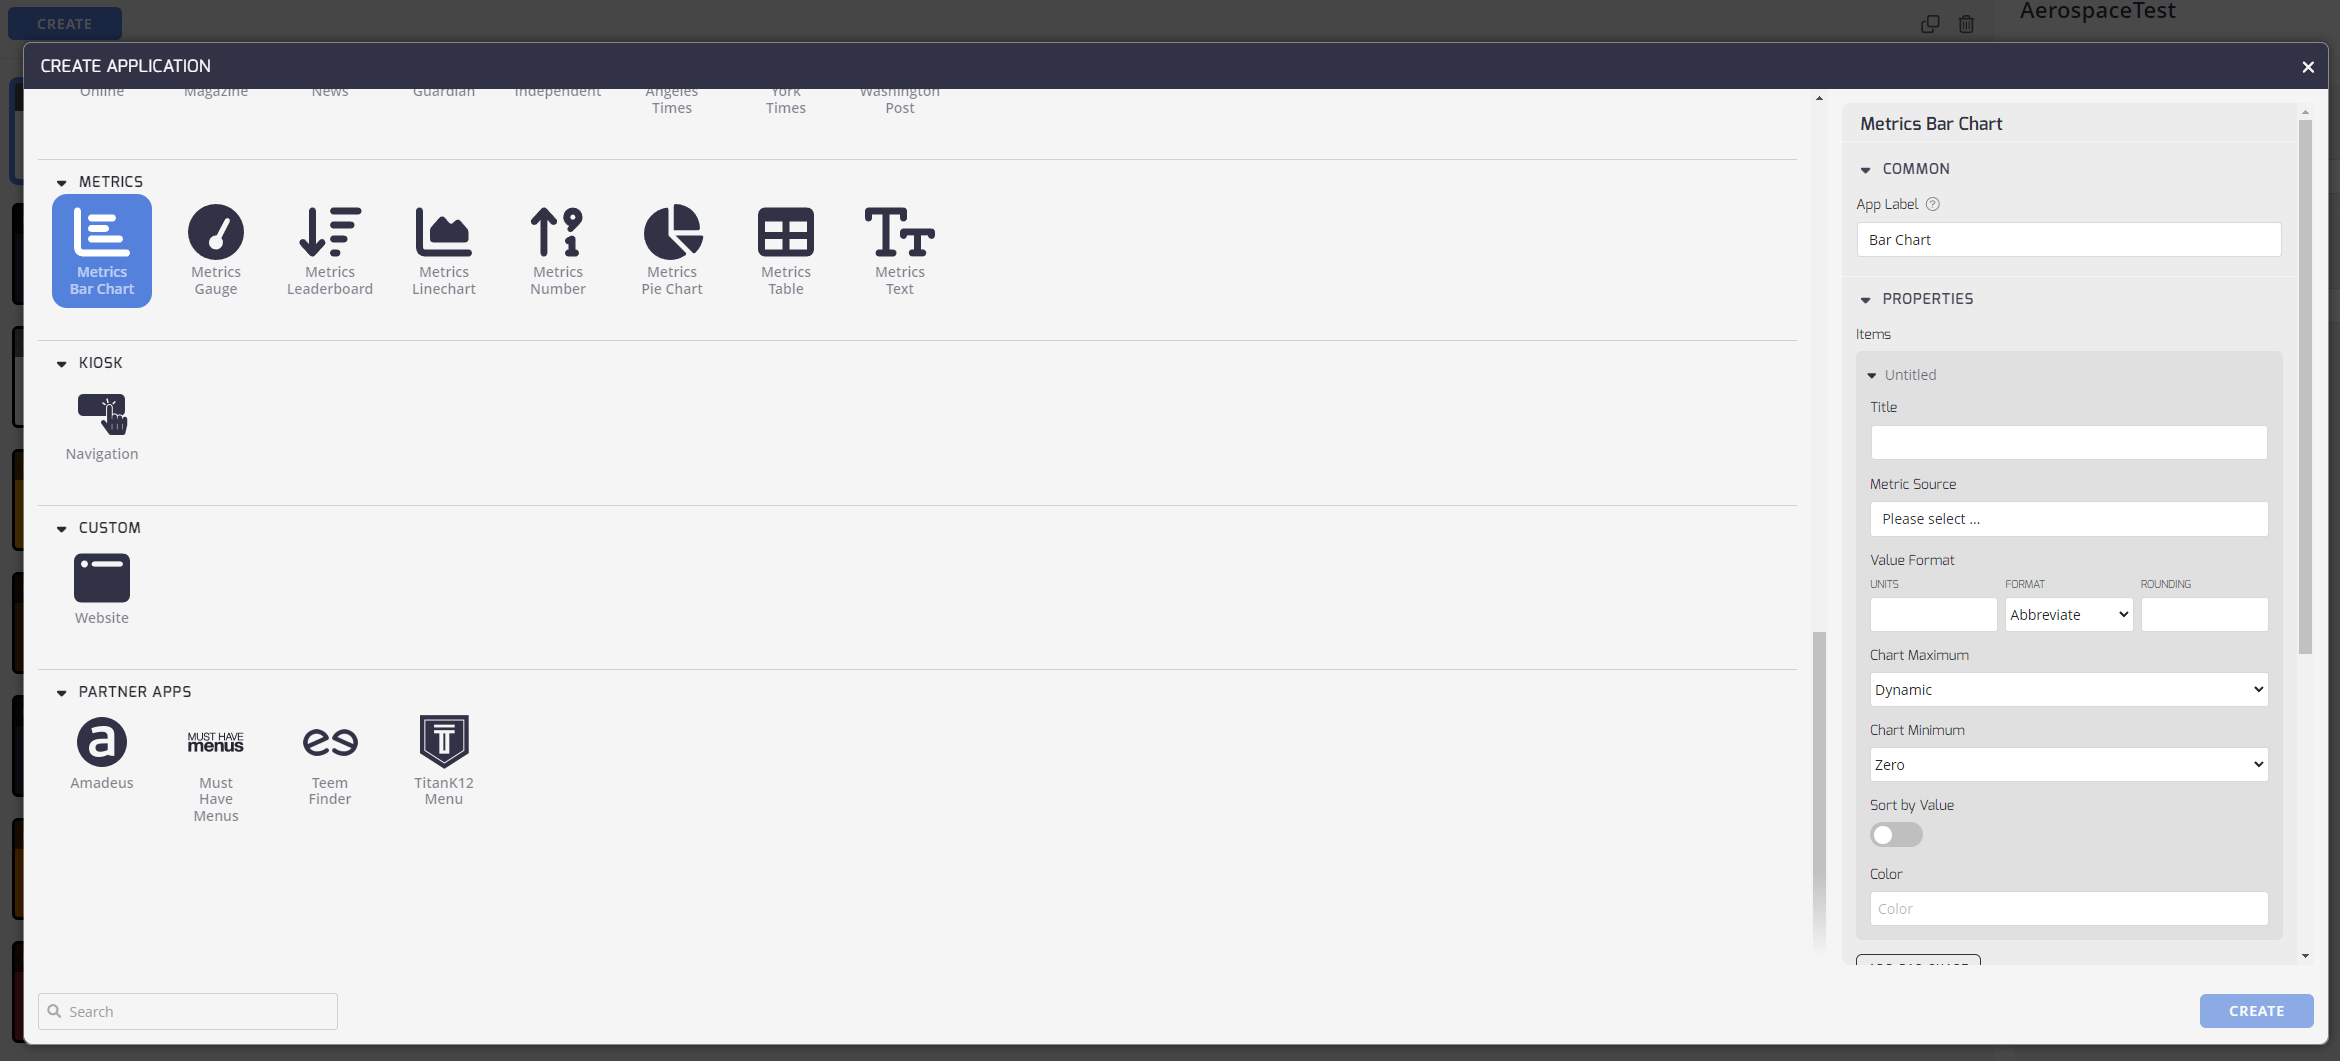
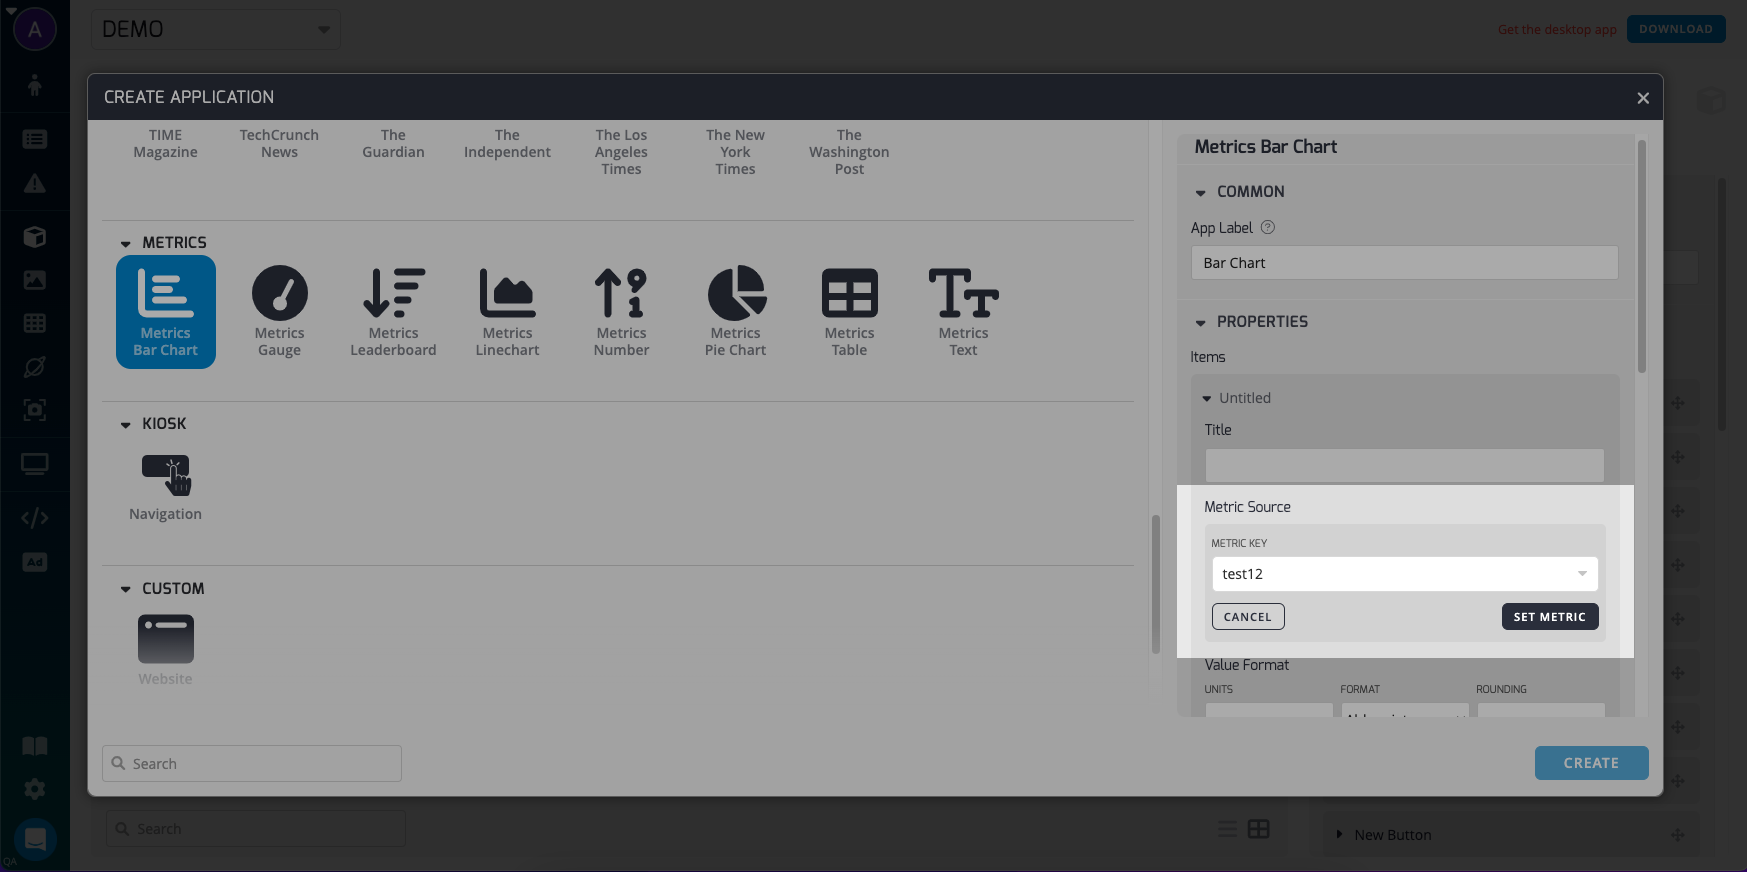
- Select the Metrics Bar Chart App from the available list of apps under Metrics, or click the Create button to select a new app.
- The configuration pane opens on the right side of the screen, .
Configuring Your Metrics Bar Chart App
Configuring the Metrics Bar Chart App: Now that you've added the Metrics Bar Chart App, it's time to set it up to meet your preferences.
Here's how:
Common
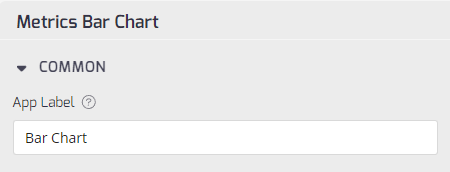
- App Label: Add an App Label to identify this app from others in your list.
Properties
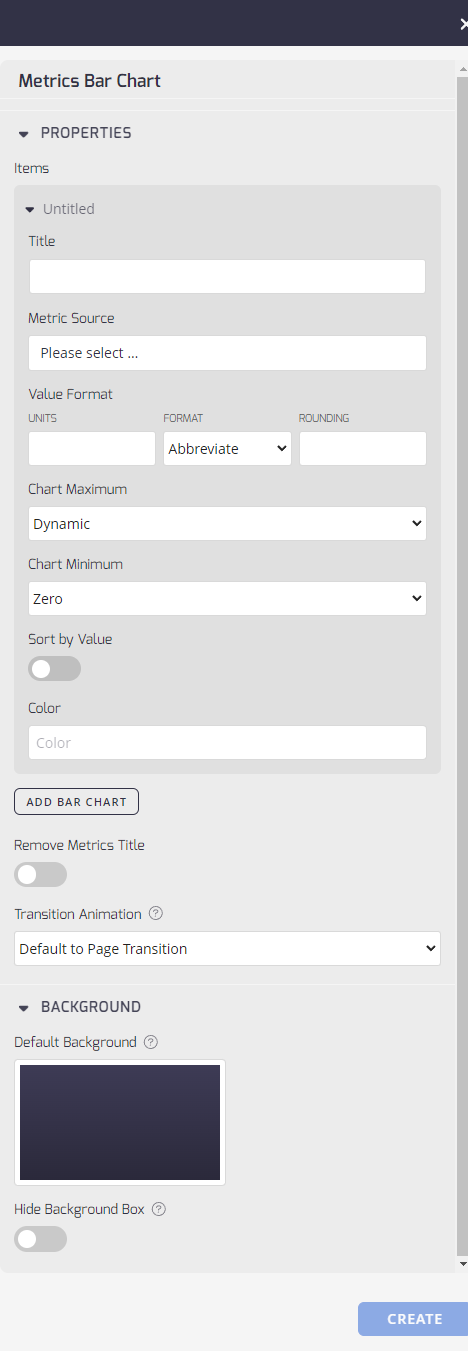
- Title: The title of the application, displayed at the top of each widget for easy identification.
- Metric Source: The source of the data displayed within the widget. Determines how the metric data is fetched and updated.
- Value Format: Allows customization of the data presentation format within the widget. Users can specify a symbol to prepend data (for example, currency symbol or temperature unit) and define rounding rules for numeric values.
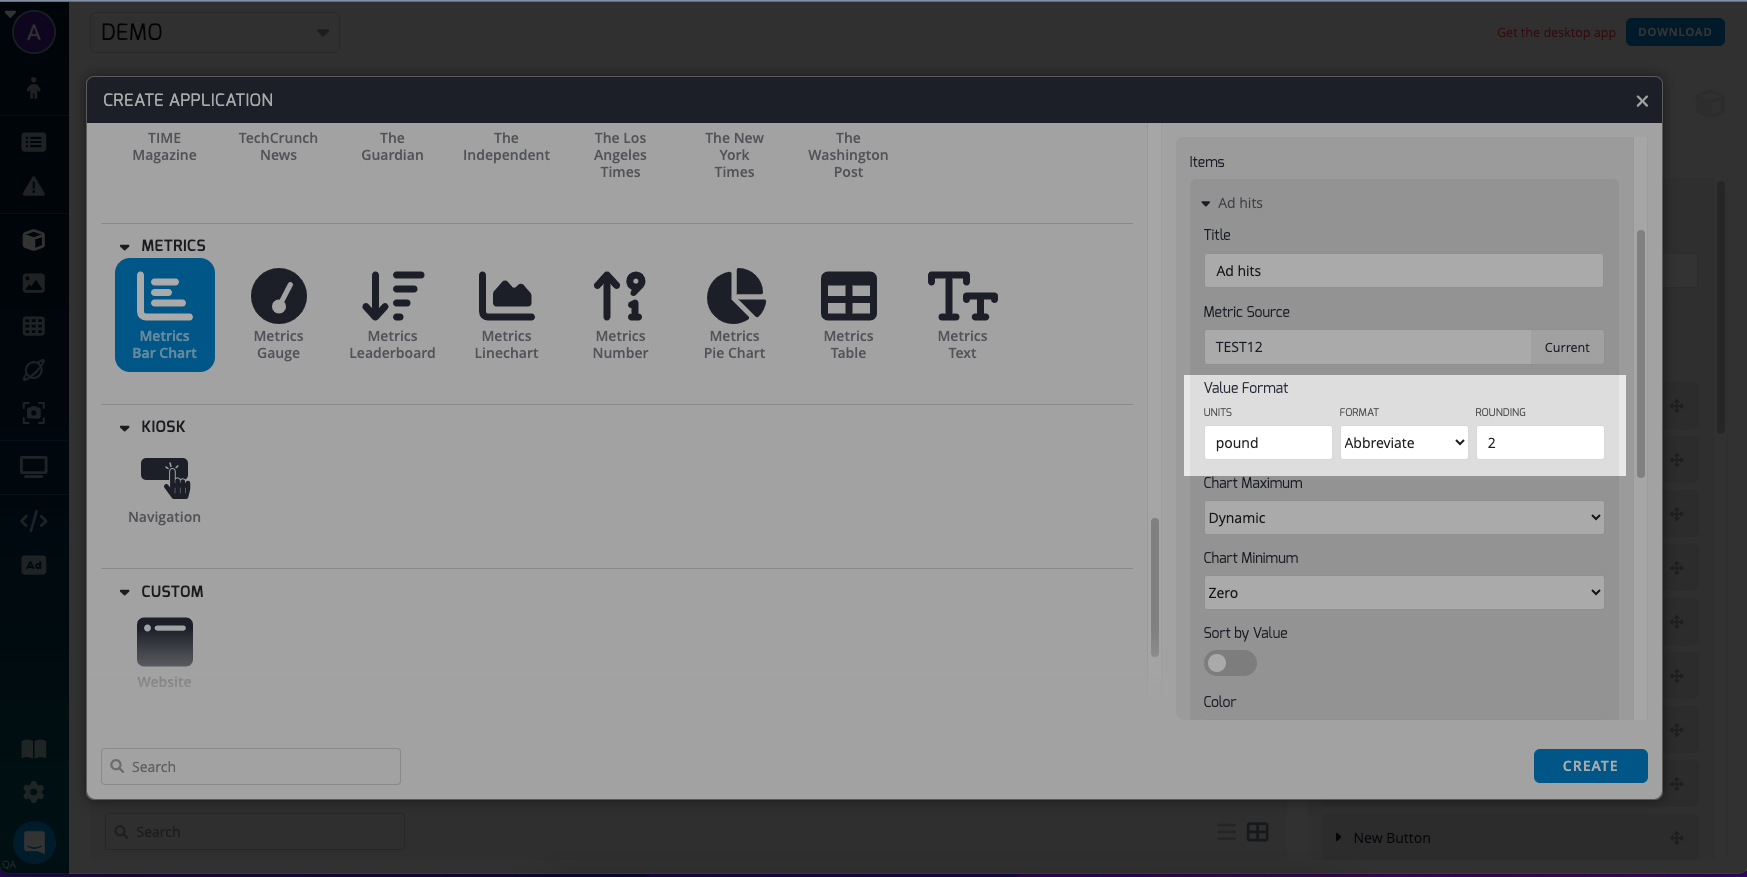
- Chart Maximum: Users can define static or dynamic behavior for the chart's maximum value display, enhancing the visualization's responsiveness to data changes. Additionally, specifying a chart minimum allows for customized data scaling.
- Chart Minimum: select a value which would be counted as zero for a chart if you want certain scaling of the data.
- Sort by Value: Enables sorting of the metric data by value, allowing users to organize the display based on data significance.
- Color: Customization of the chart's color scheme, facilitating visual differentiation and thematic consistency.
- Add Bar Chart Button: You can create multiple bar charts to display sequentially, click the Add Bar Chart button.
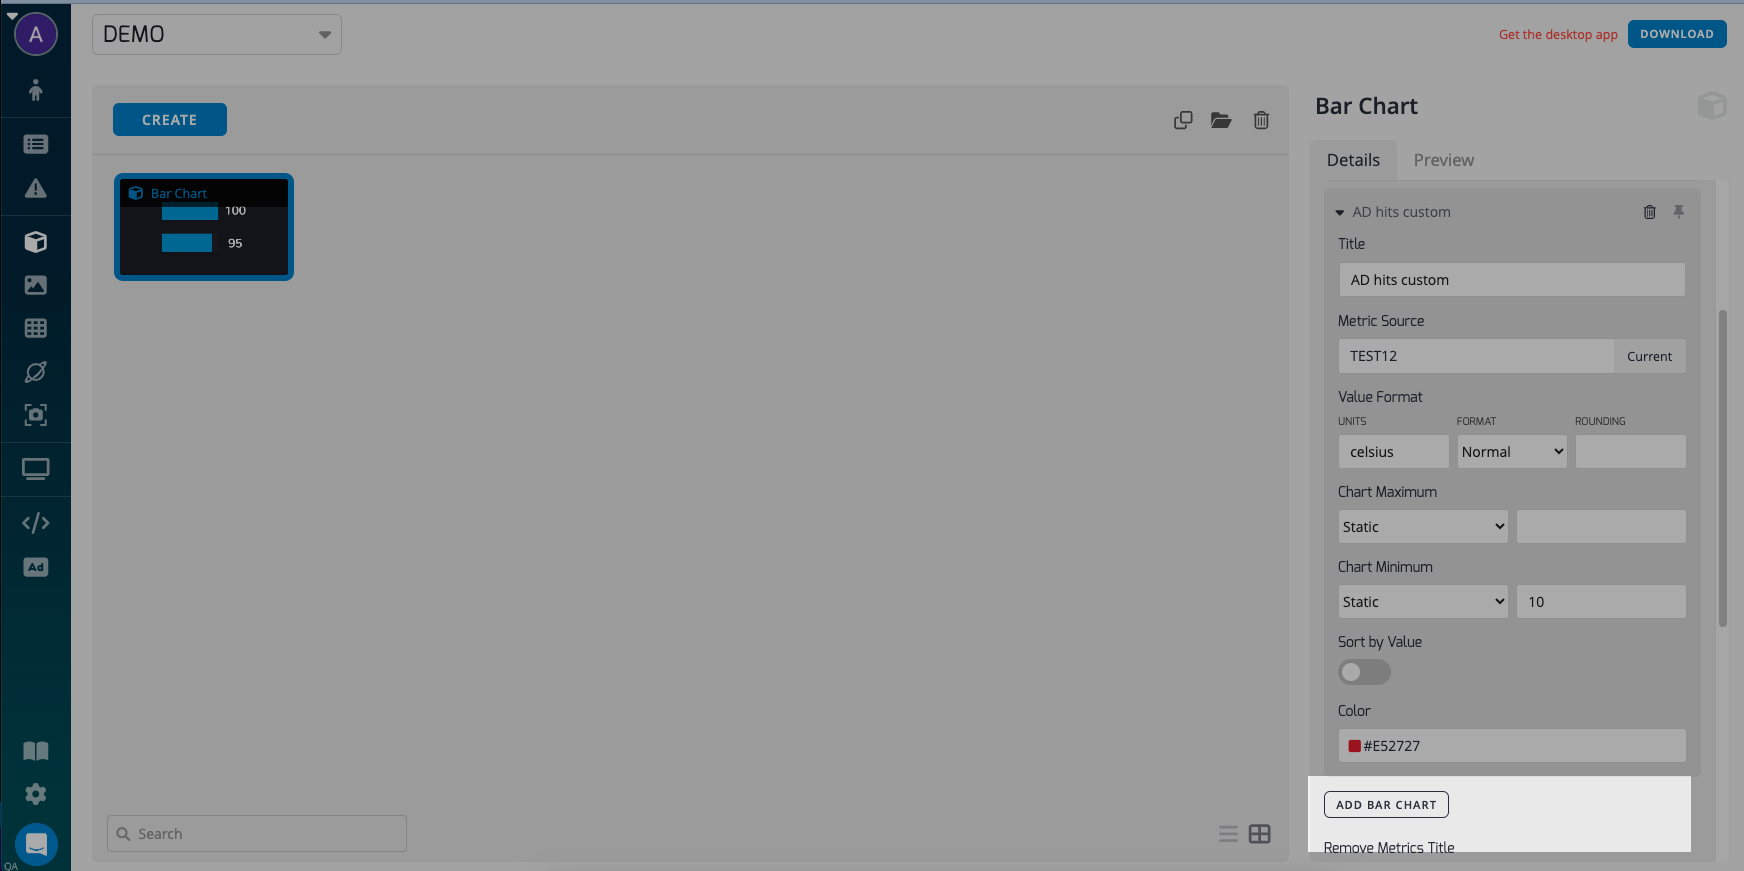
- Remove Metrics Title: Provides the option to hide the application title during playback, offering a more streamlined visual presentation.
- Transition Animation: This drop-down menu allows you to set the transition effect between items.
Background
- Default Background: Select the background image as in the rest of the apps Custom Backgrounds
- Hide Background Box: Toggle this to hide the semi-transparent background box around your content.
Click the Create button to finish the app and return to the Apps listing.
Updated 8 months ago