
Metrics Linechart App
How to use the Metrics Linechart app
What is the Metrics Linechart App?
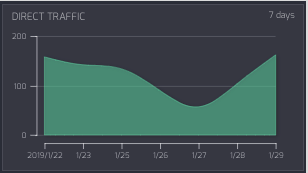
This widget allows you to generate a line chart with metrics data. Number only (with a set bucket/range) or Set (of numbers). The widget displays the changes of the value of a number metric over time, or plots the values of a set (equally spaced, and in order). You can select from a variety of chart types within this widget, such as scatter plot or area.
Adding the Metrics Linechart App
To get started with the Metrics Linechart App, follow these simple steps:
- From the lefthand taskbar navigate to the Apps tab.
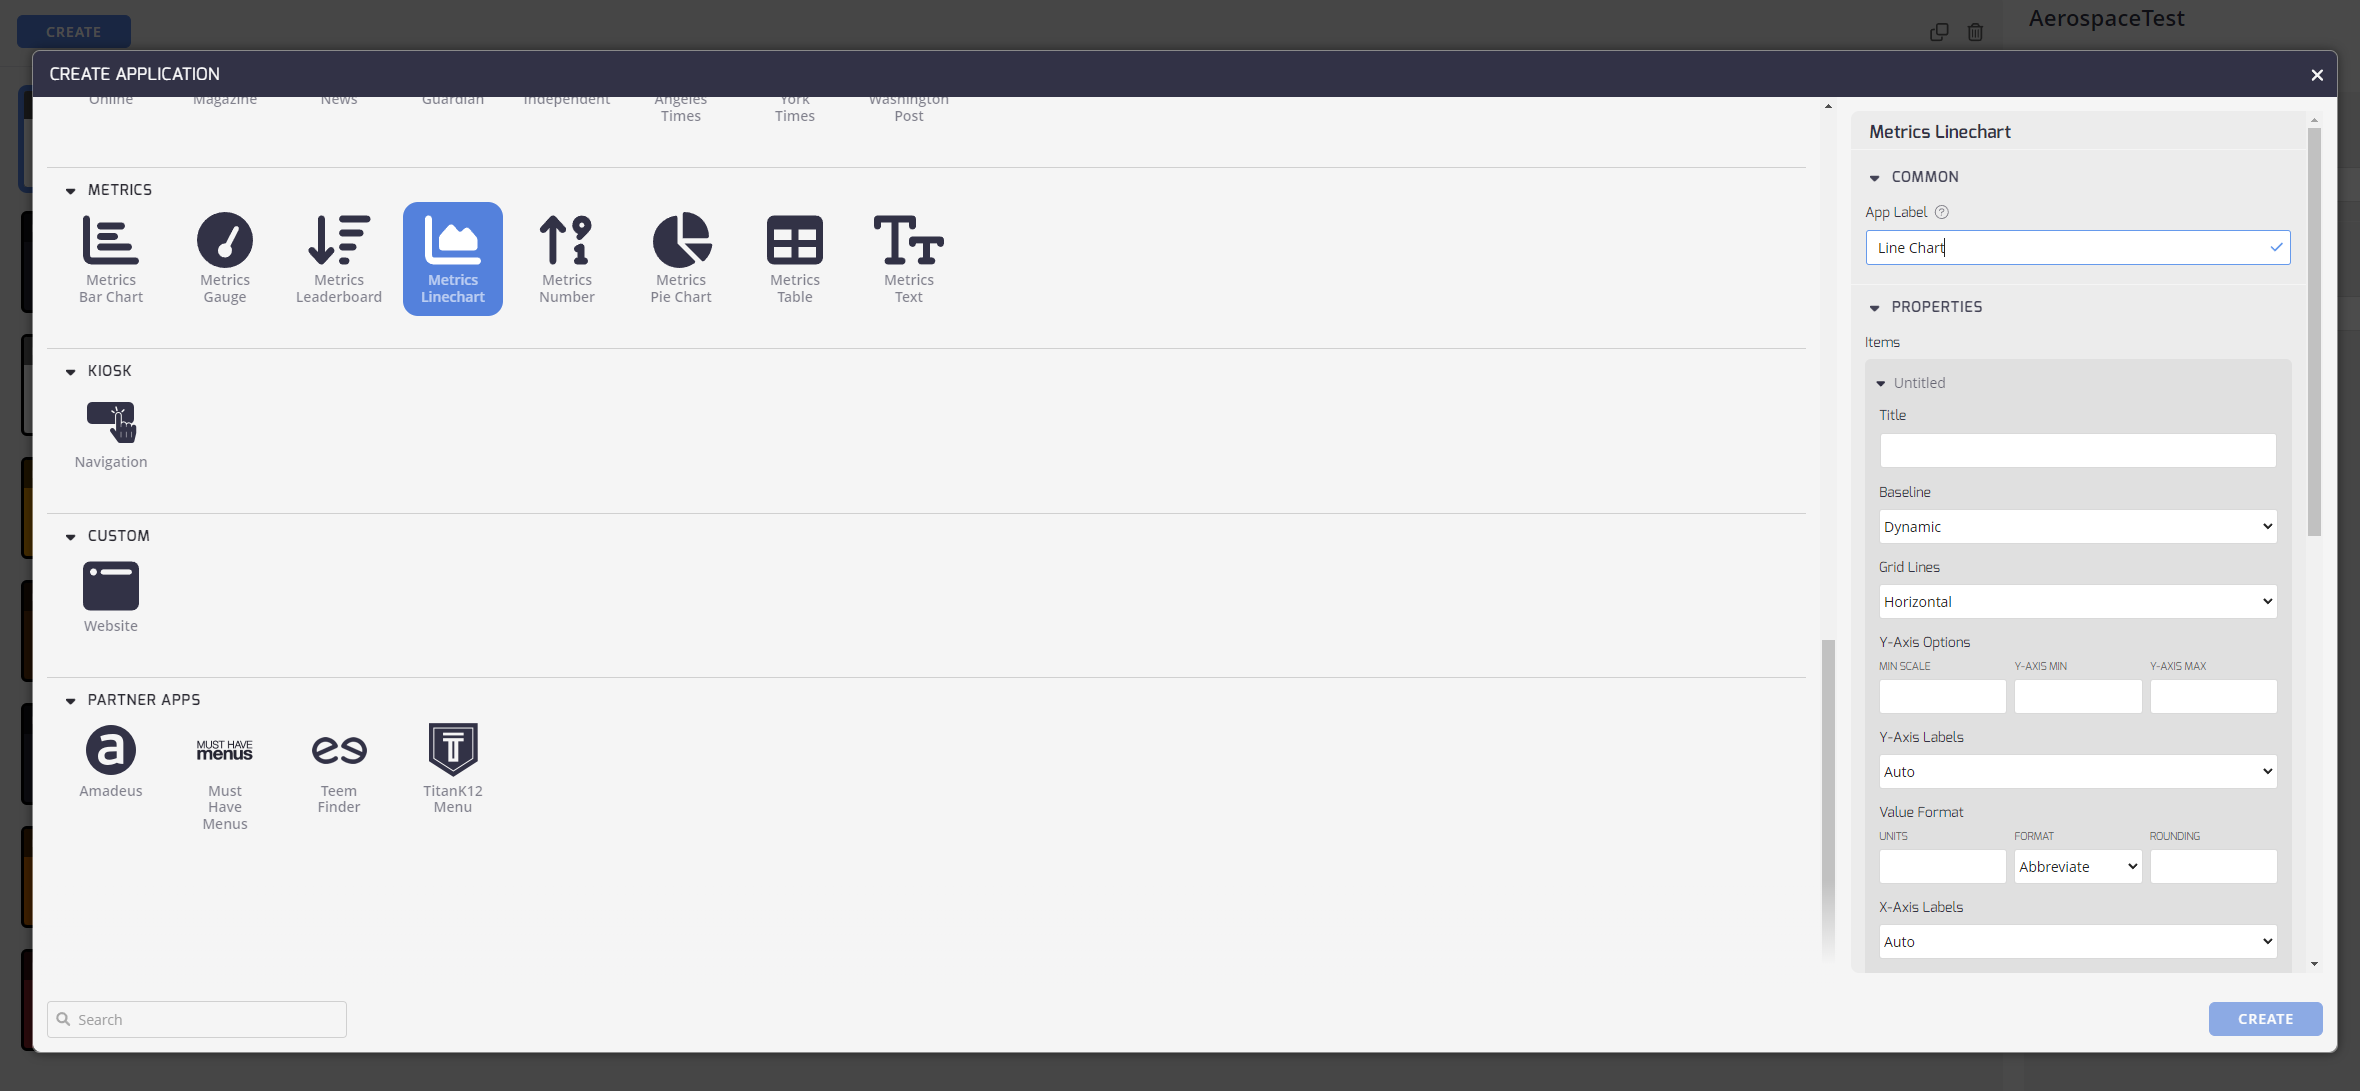
- Select the Metrics Linechart App from the available list of apps under Metrics, or click the Create button to select a new app.
- The configuration pane opens on the right side of the screen, .
Configuring Your Metrics Linechart App
Configuring the Metrics Linechart App: Now that you've added the Metrics Linechart App, it's time to set it up to meet your preferences.
Here's how:
Common
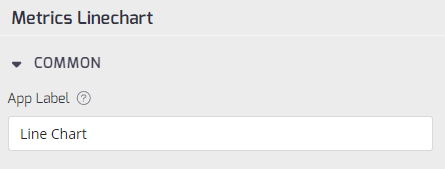
- App Label: Add an App Label to identify this App from others in your list.
Properties
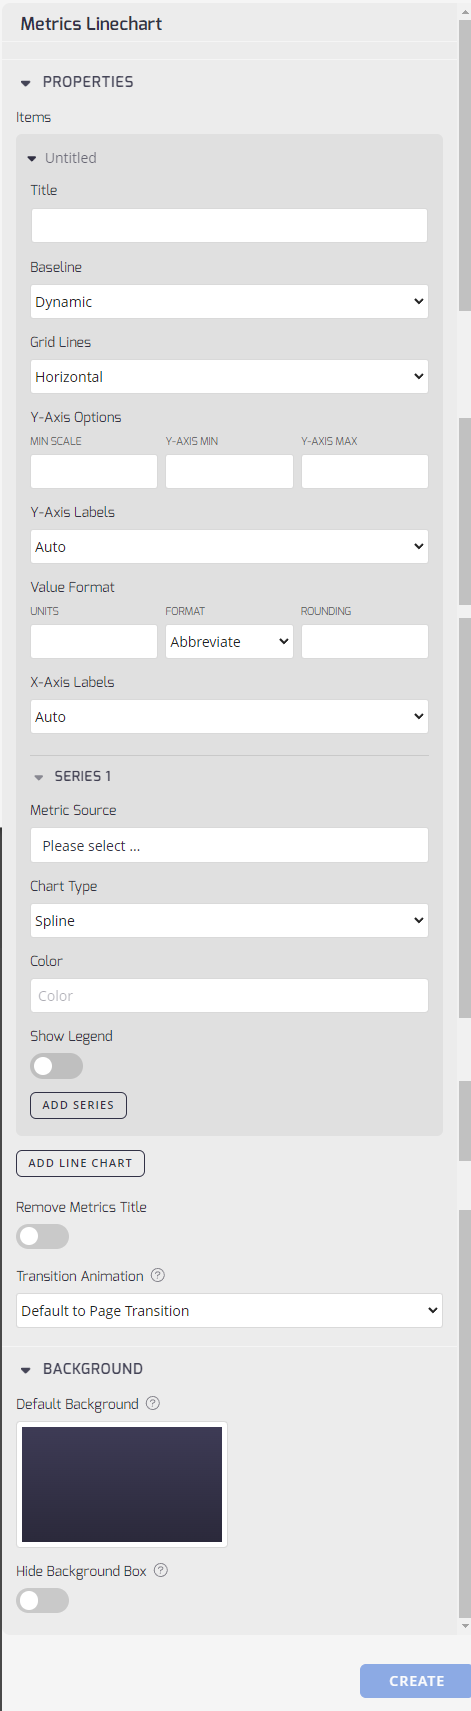
- Title: Enter a title for your new app.
- Baseline: From this drop-down menu, select the baseline for the linechart. Options are either Dynamic or Zero. This affects where the baselines starts from on the linechart.
- Grid Lines: From this drop-down menu, select the type of grid lines you want on the linechart. Options are Horizontal, Vertical, or Both.
- Y-Axis Options: Enter a number for the Min Scale of the y-axis, as well as the Y-Axis Min and Y-Axis Max. These options display the scale for the y-axis.
- Y-Axis Labels: From this drop-down menu select how the y-axis labels will be displayed. Can be Auto, None, or Custom.
- Value Format: Allows customization of the data presentation format within the widget. Users can specify a symbol to prepend data (for example, currency symbol or temperature unit) and define rounding rules for numeric values
- X-Axis Labels: From this drop-down menu select how the x-axis labels will be displayed. Can be Auto, None, or Custom.
- Series Section: The series section allows you to customize sections of the linechart. You can add multiple series to the chart.
- Metric Source: The source of the data displayed within the widget. Determines how the metric data is fetched and updated.
- Chart Type: From this drop-down menu, select the chart type you want to display for this series. Options are Spline, Line, Area, Scatter, Bar, Stacked Bar, or Horizontal Bar.
- Color: Customization of the chart's color scheme, facilitating visual differentiation and thematic consistency.
- Show Legend: Click this radio button to either show the legend on the chart or hide it.
- Add Series Button:Click this button to add another series to a section of the chart.
- Add Line Chart: Click this button to add another linechart to the widget.
- Remove Metrics Title: Provides the option to hide the application title during playback, offering a more streamlined visual presentation.
- Transition Animation: This drop-down menu allows you to set the transition effect between items.
Background
- Default Background: Select a background for this app.
- Hide Background Box: Toggle this to hide the semi-transparent background box around your content.
Once you are done, click the Create button to finish setting up the app and it is now ready to use on your Playlist.
Updated 8 months ago