Debug Console
Enable the debug console
Enabling the Debug Console
There are two ways to enable debug console:
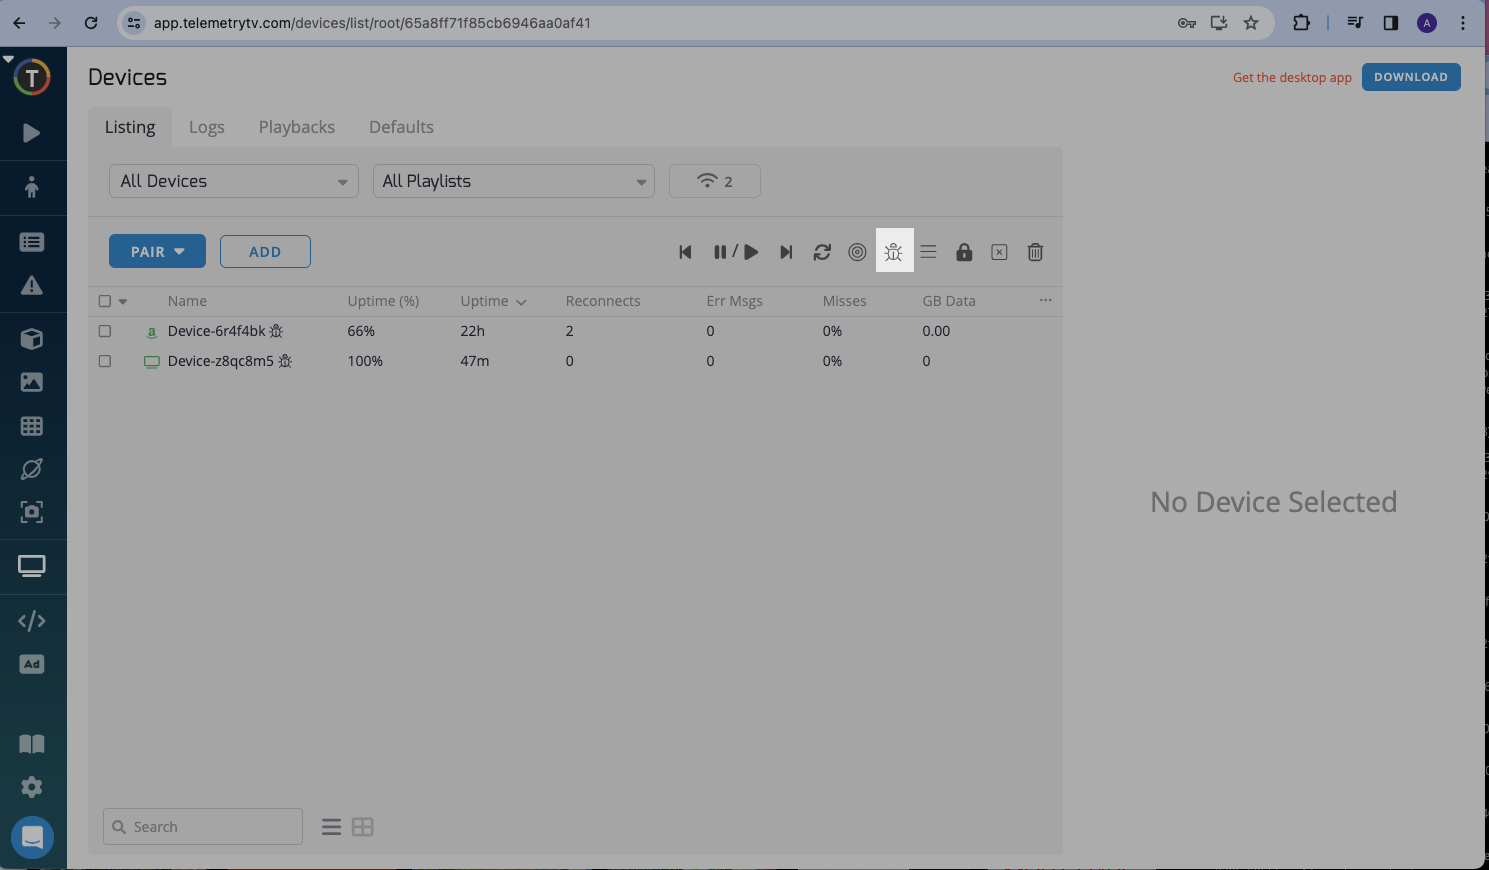
- The TelemetryTV app on devices page.
- From the device (requires remote or keyboard).

For Windows, Linux, TelemetryTV Box OS, or PWA if you press the Escape button (ESC) from the keyboard opens or closes the Debug Console.
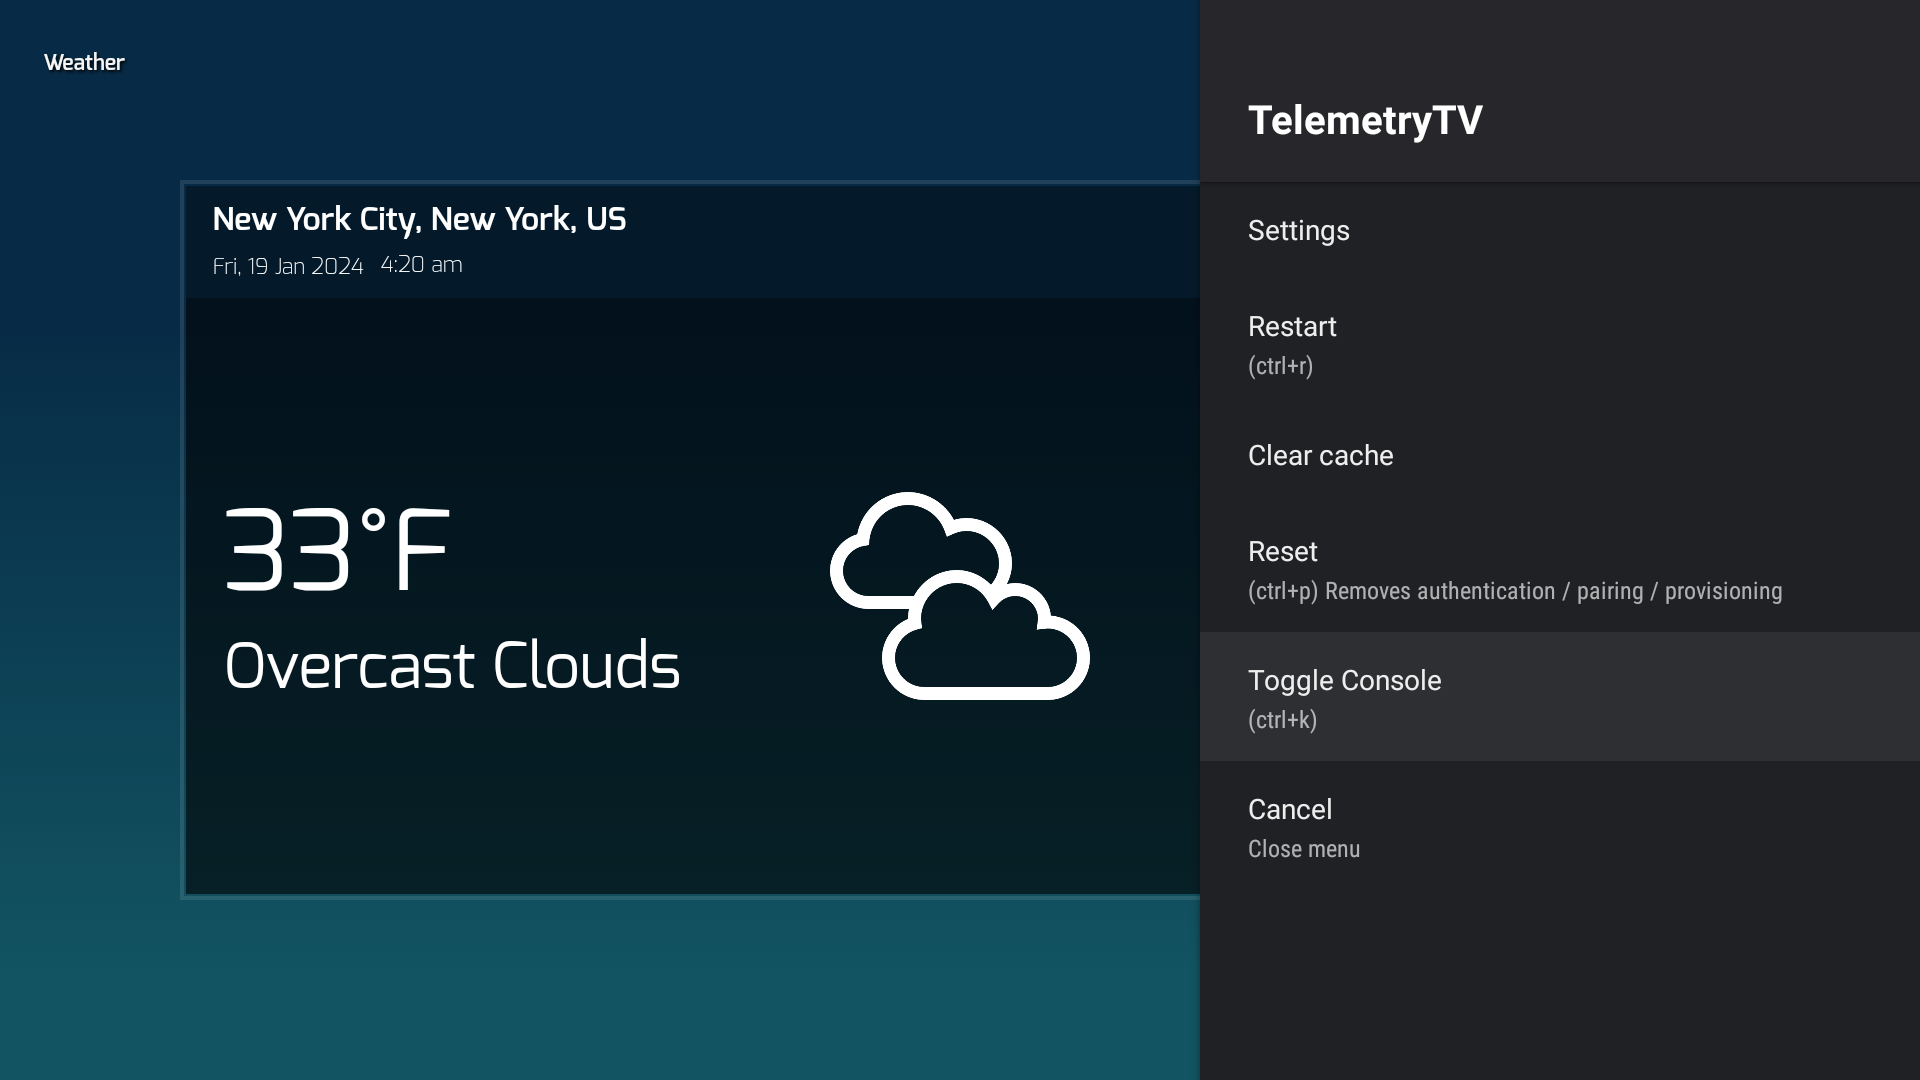
For Android there is also a menu option:

Debug Console Features
Troubleshooting
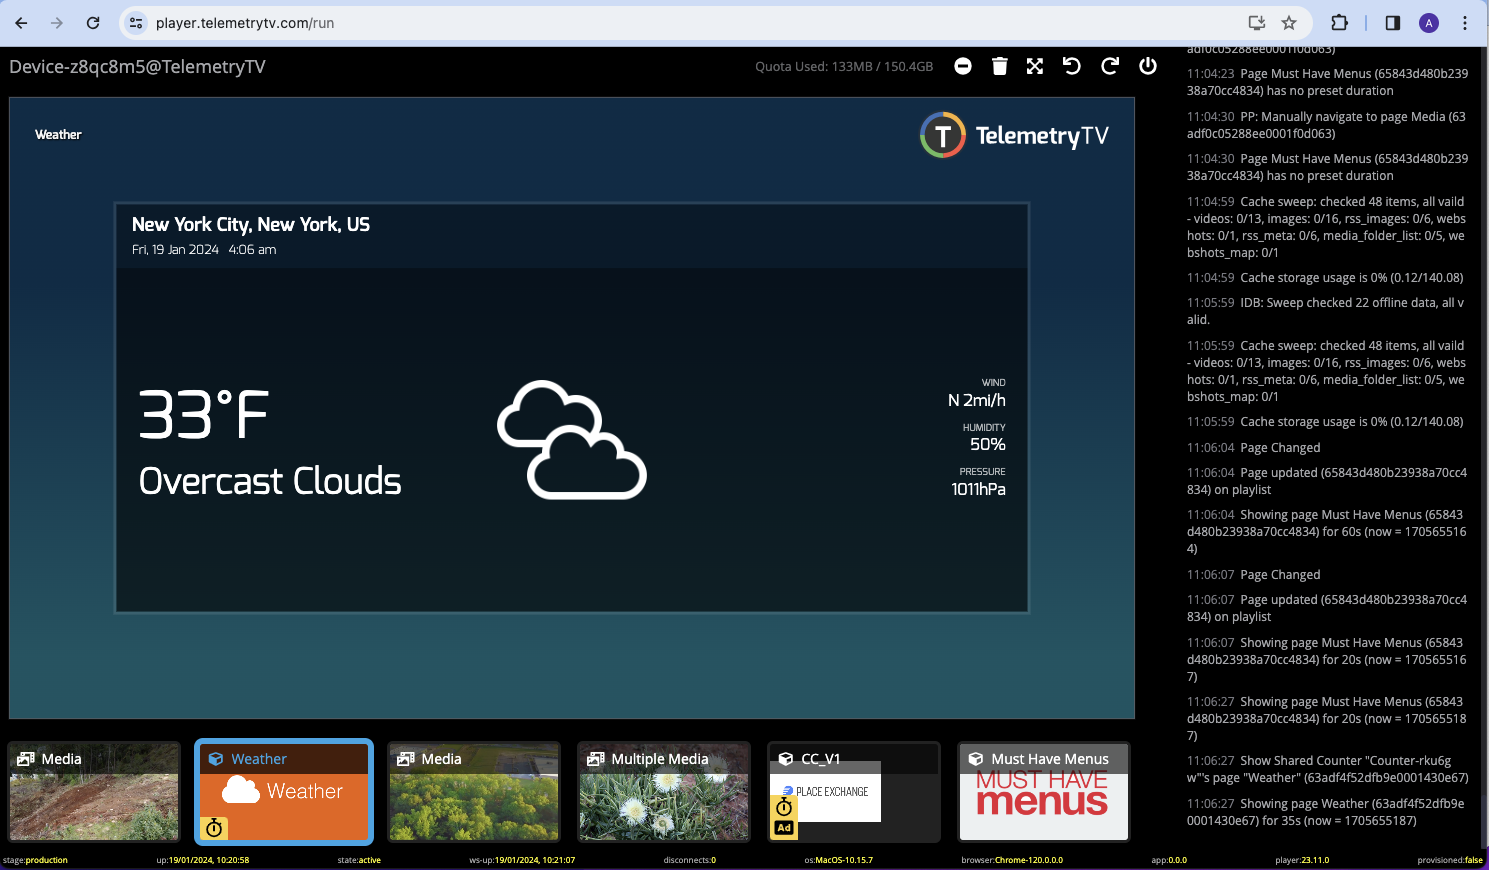
It allows developers and support teams to monitor real-time logs(right section of a screen), making it easier to diagnose issues as they occur. This is particularly useful for identifying errors or anomalies that may not be immediately apparent in the application's UI.
Monitoring
The log messages provide insights into the behavior of the app, such as cache sweeps, page changes, and updates. This real-time monitoring can be valuable for understanding the app's performance and operational status.
Performance Analysis
By observing the frequency and type of logs, one can analyze the performance and responsiveness of the app. For example, if cache sweeps are happening too frequently, it might suggest that the app's cache management could be optimized.
Identify Device Name
Located in the top left corner, the device name is a fundamental identifier, allowing users and administrators to quickly ascertain which device's data they are viewing.
Device Actions
The top right side of the screen features device actions. These are duplications of the device panel functionality found within the TelemetryTV app interface. Having these actions accessible from the debug console allows for convenient and immediate operations
Playback Thumbnails
The bottom section of the interface contains thumbnails that represent a visualization of playback, with the current page that is playing being highlighted. This visual cue allows users to see at a glance what content is currently being displayed on the digital signage, which is particularly useful for ensuring that the correct media is in rotation and for verifying the playback sequence.
Debug Ribbon
The bottom line of the interface serves as a debug ribbon, displaying the versions of the app, operating system, and player. This information is crucial for support and development teams to ensure that the device is running the expected versions.

Updated 5 months ago