
Metrics Pie chart App
How to use the Metrics Pie Chart app
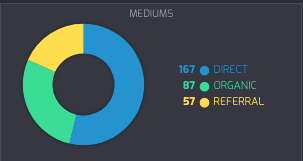
What is the Metric Pie Chart App?
The Metric Pie Chart app generates a pie chart with metrics data. It allows you to enter either a dictionary or multiple number metrics as slices for comparison as a pie chart.
Adding the Metrics Pie Chart App
To get started with the Metrics Pie Chart App, follow these simple steps:
- From the lefthand taskbar navigate to the Apps tab.
- Select the Metrics Pie Chart App from the available list of apps or click the Create button to select a new app.
- Click the Next button..
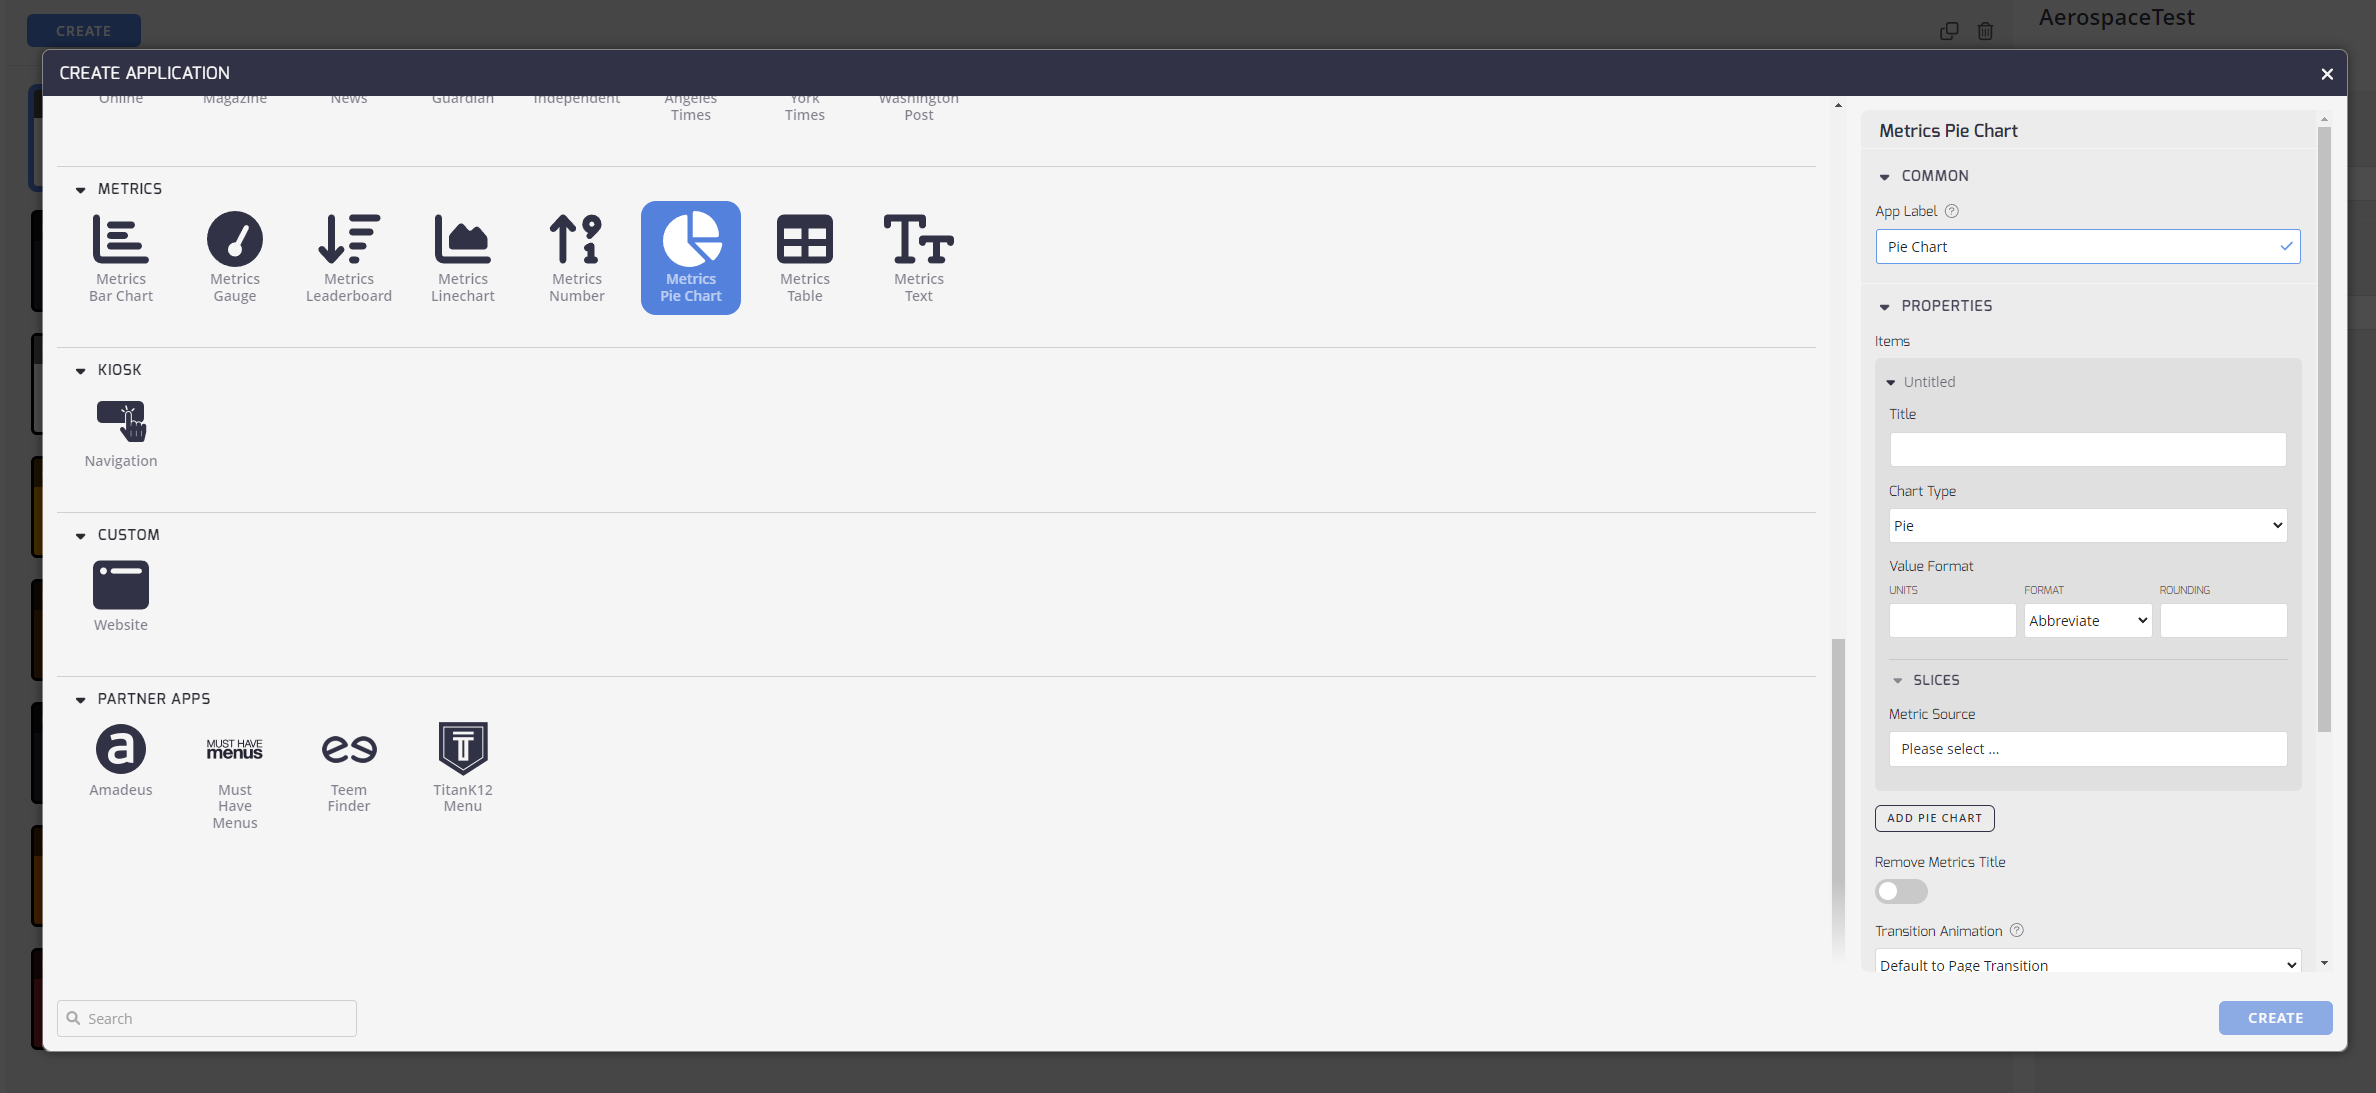
Configuring Your Metrics Pie Chart App
Configuring the Metrics Pie Chart App: Now that you've added the Metrics Pie Chart App, it's time to set it up to meet your preferences.
Here's how:
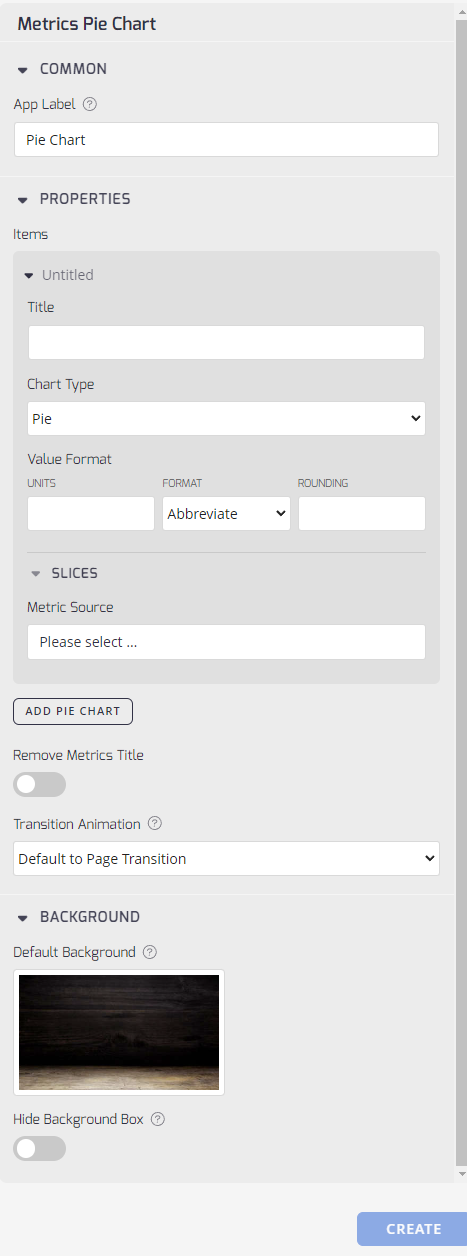
Common
- App Label: Add an App Label to identify this App from others in your list.
Properties
-
Title: Enter a title for your new app.
-
Chart Type: From the drop-down menu, select the type of chart you want to use. Options are Pie, Chart, or Ring.
-
Value Format: Allows customization of the data presentation format within the widget. Users can specify a symbol to prepend data (for example, currency symbol or temperature unit) and define rounding rules for numeric values
-
Metric Source: The source of the data displayed within the widget. Determines how the metric data is fetched and updated.
-
Add Pie Chart Button: You can create multiple pie charts to display sequentially, click the button to add a new one.
-
Remove Metrics Title: Provides the option to hide the application title during playback, offering a more streamlined visual presentation.
-
Transition Animation: This drop-down menu allows you to set the transition effect between items.
Background
-
Default Background: Select a background for this weather app.
-
Hide Background Box: Toggle this to hide the semi-transparent background box around your content.
Click the Create button to finish the app and return to the Apps listing.
Updated 9 months ago