Grafana App
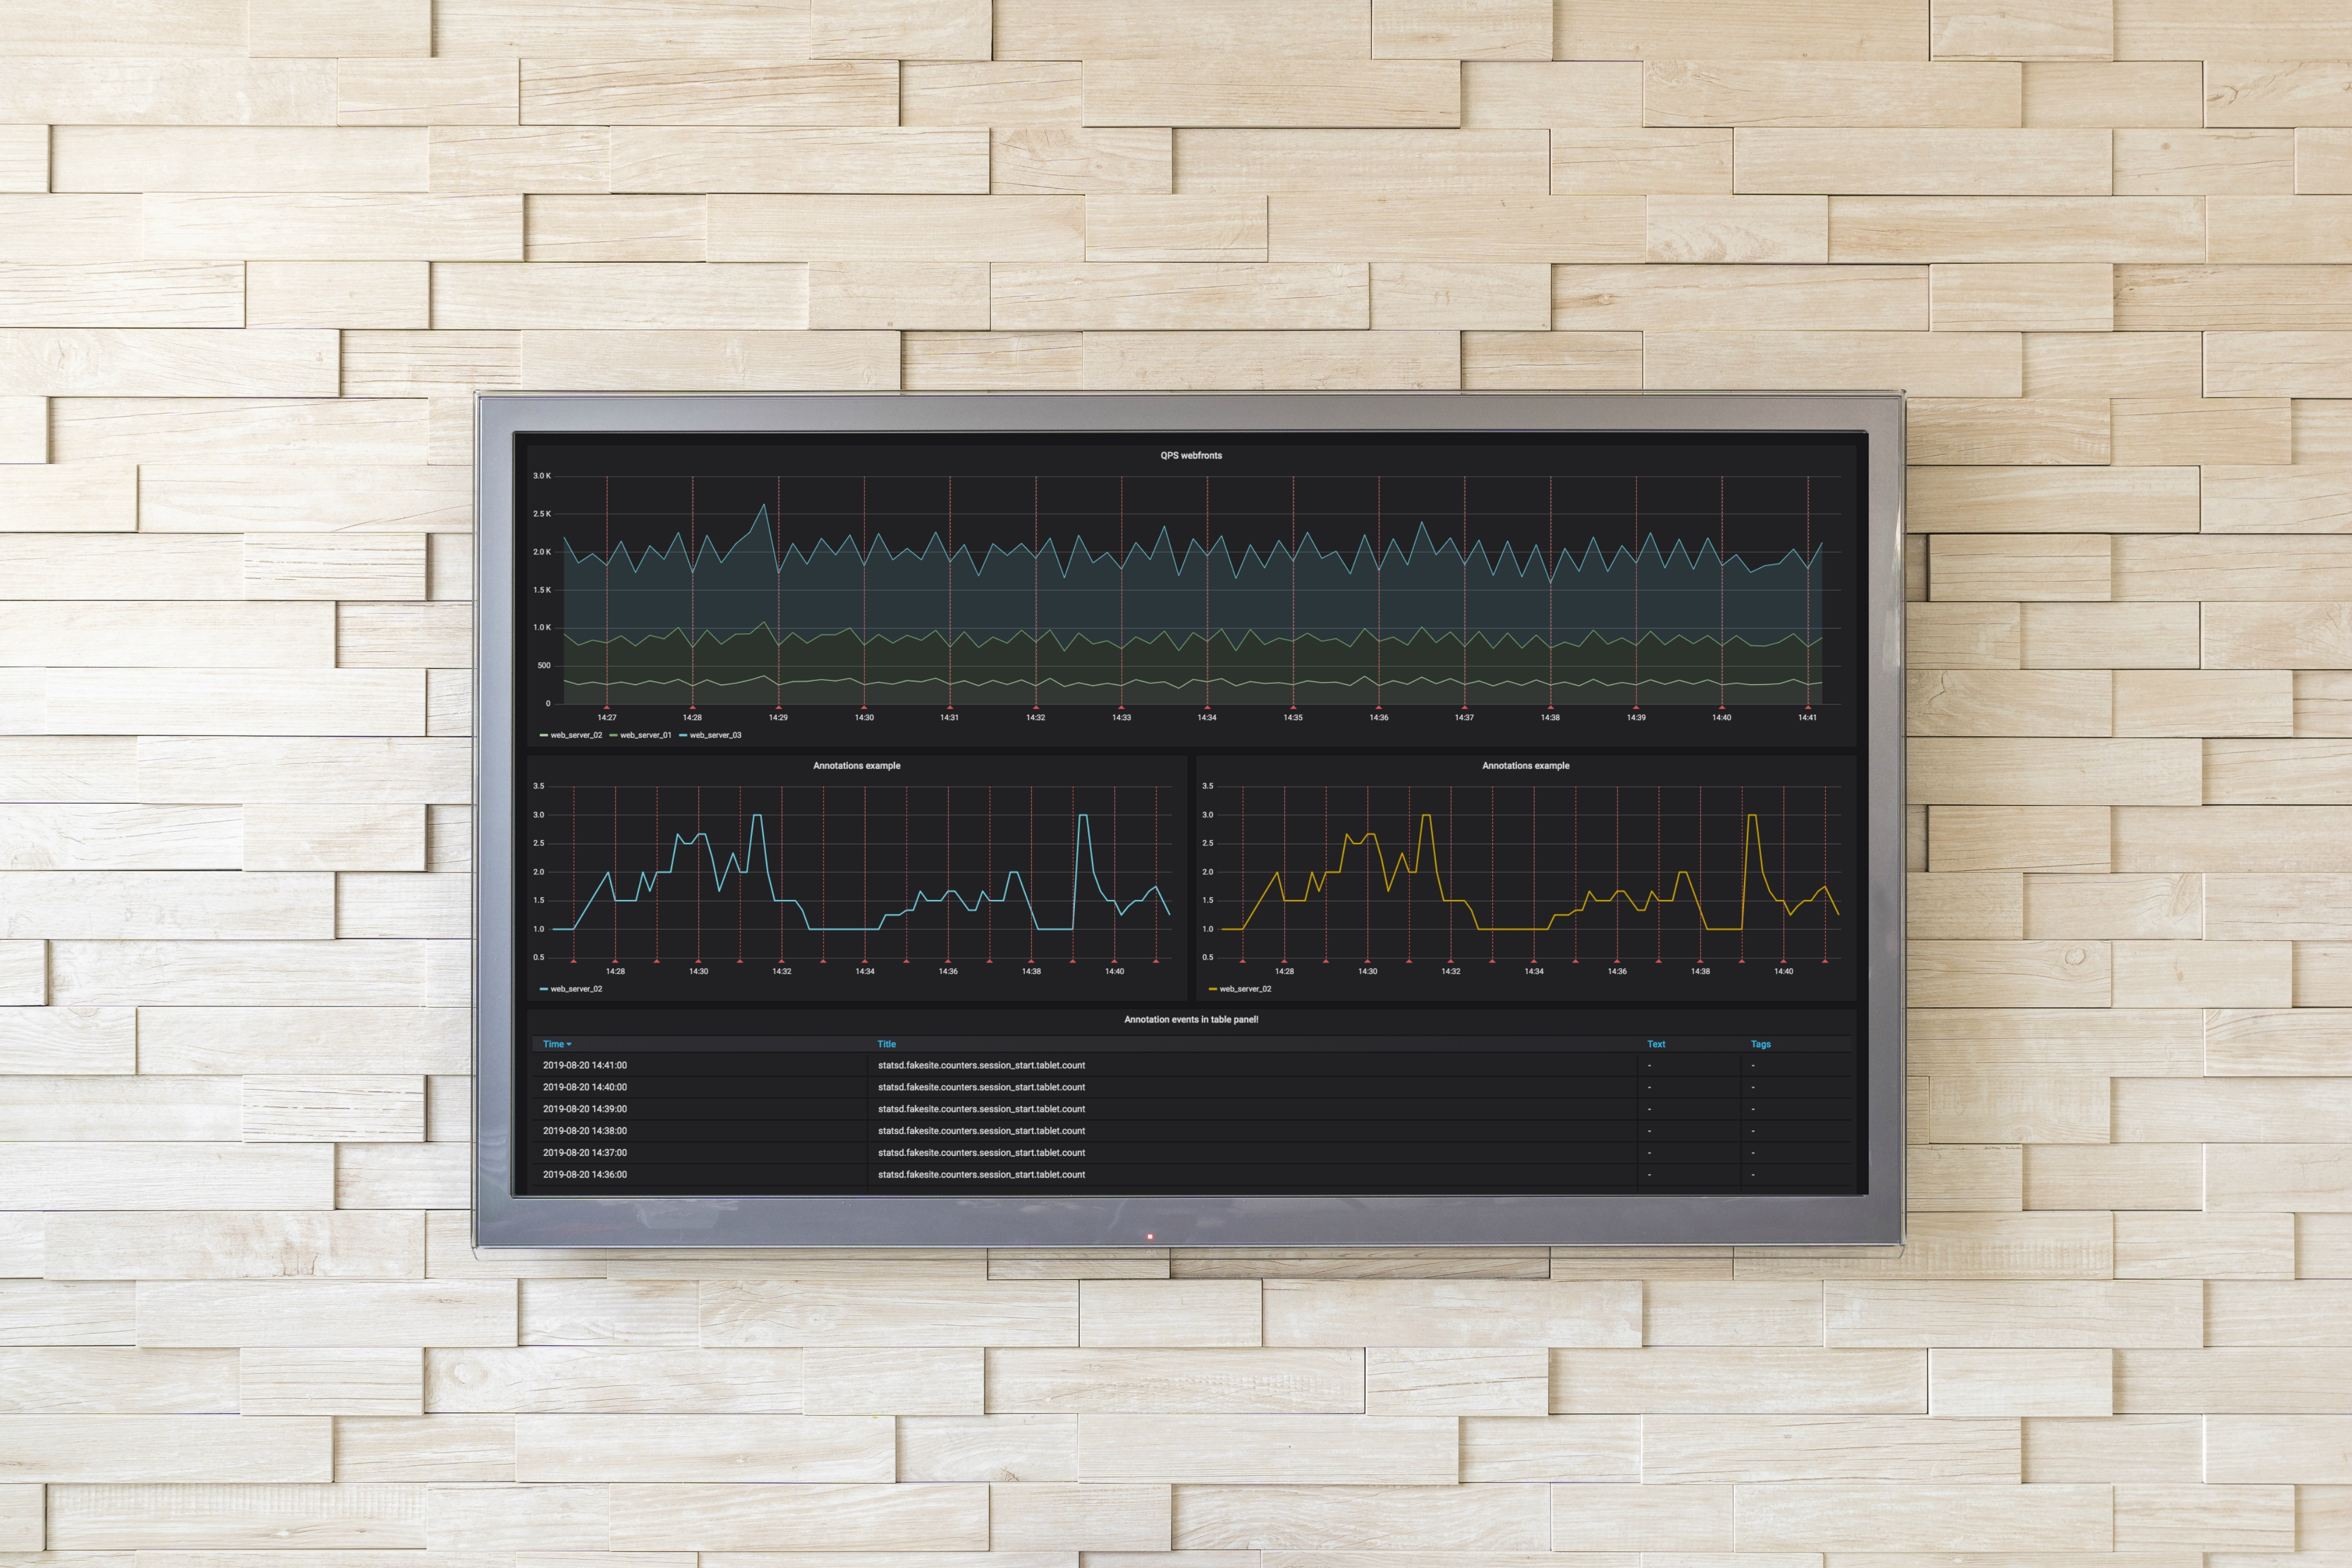
Grafana is the leading open source project for visualizing metrics. Now, TelemetryTV's Grafana app allows you to display your Grafana dashboards on screen with ease.
Setting Up the App
- Log in to your TelemetryTV account and navigate to the Apps page.
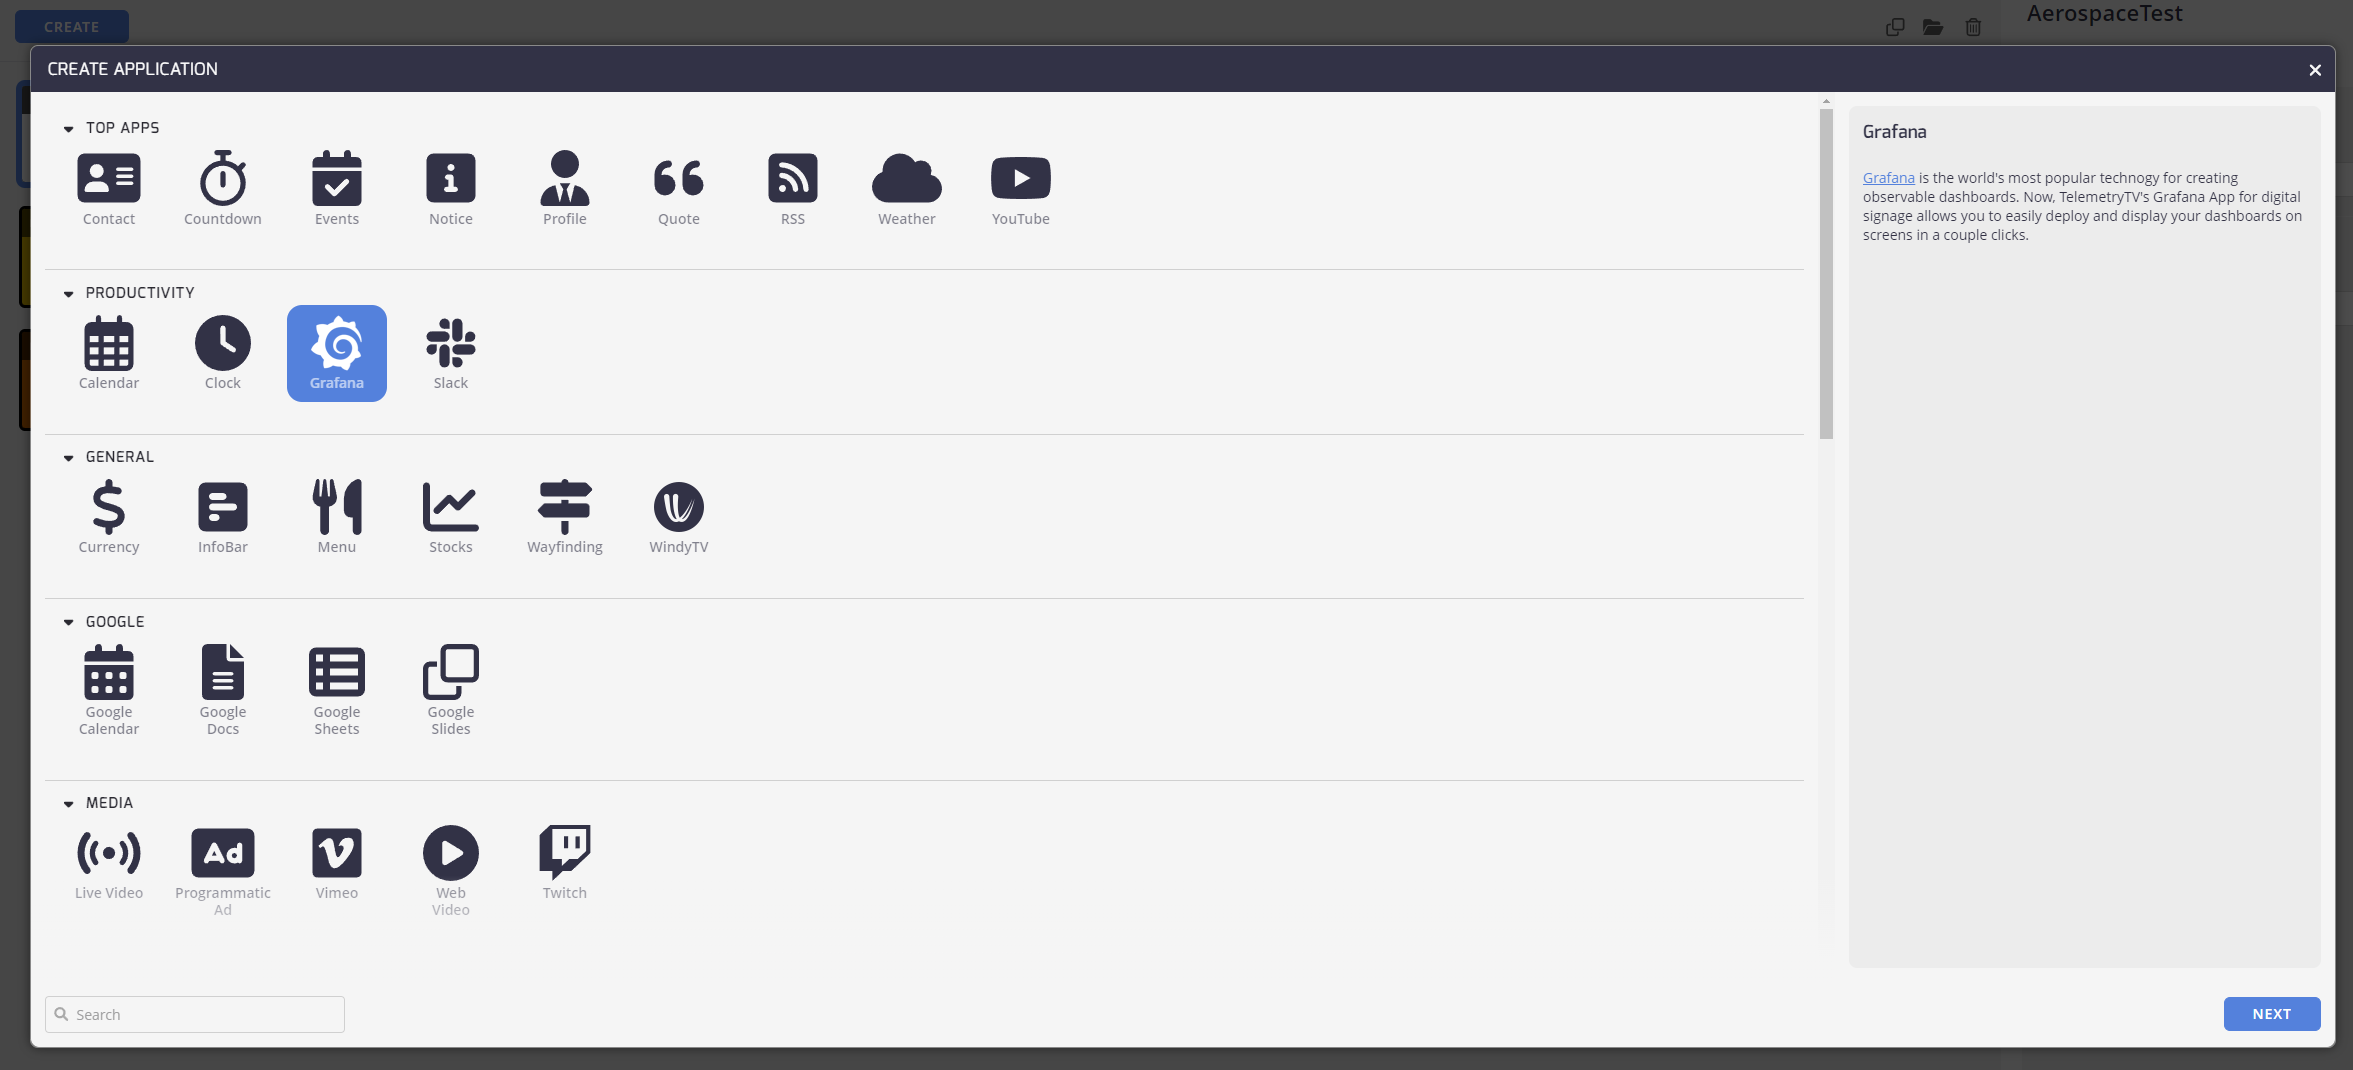
- Click the Create button to launch the application list.
- Search for Grafana in the bottom right of the application list, then select the Grafana App.

Common

- Give the app a Label to easily identify it next to your other apps.
Properties

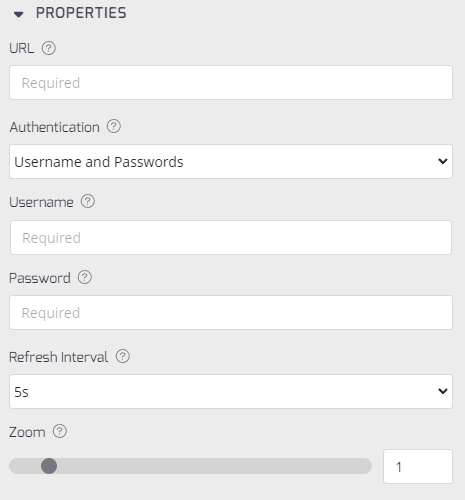
- URL: Grab the URL of the Grafana dashboard you'd like to display. This URL should start with "play.grafana"
- Authentication: Enter the authentication method from the drop-down menu. Options are Usernames and Passwords, or None. See Authentication section below.
- Username: Enter your username for authentication.
- Password: Enter your password for authentication.
- Refresh Interval: Enter the dashboard refresh rate in seconds from the drop-down menu.
- Zoom: Set a scale to zoom the dashboard in or out using the sliding scale or enter a number.
Click the Create button to finish and open your Grafana app.
Authentication Options
- If your dashboard is private, you need to authenticate with your Grafana username and password. Select this identification option and enter your credentials in the fields below.
- If your dashboard is public, there is no need to authenticate. Select None from the drop-down menu.
Important noteThis will not work if you use a login from a third-party website to access the website you would like to display (OAuth). For example, if you login via Facebook or Google. The credentials you use must be set up through Grafana.
Finally, select the interval at which you'd like the dashboard to refresh.
Once finished, click Create. You can now preview or edit your app from the Apps page on the right hand side.

Grafana support
The Grafana app is supported by devices like our TelemetryTV Box OS, Android, and Fire TV, and is not supported by any browser.
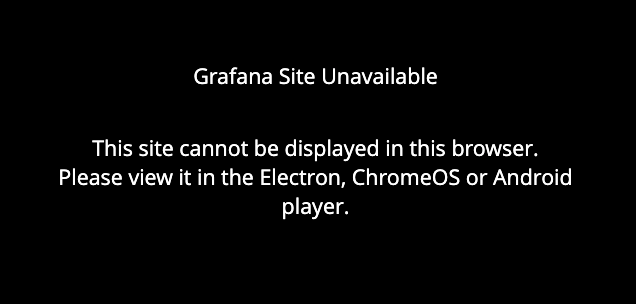
Trying to access the app through a browser displays the following message:

Once the Grafana app is set up and ready to use, the dashboard is displayed with a link through these devices.
Updated 5 months ago