Troubleshooting the Player
Common issues with the TelemetryTV player
Troubleshooting Device Playback Issues
This guide walks through our debugging process for player issues. In order to identify the cause of any playback issues you’re having, we ask that you walk through the following debug steps to provide log information to our development team. This will help our team identify and try to reproduce the issue.
Trusted Root Certificates
How can I install a Trusted Root Certificate on our TelemetryTV OS machine?
Unfortunately at this time it is not possible for a customer to do this.
Testing from the Browser
Testing from a browser makes things easier to test and if you can reproduce the issue there, then it will be a quicker resolution. If the browser does not exhibit the problem, it will help us narrow the issue down to something to do with devices. Here’s how:
- Go to https://player.telemetrytv.com on Chrome and pair the device to your account. You’ll then run your test with that browser, where you can take the Internet offline, etc.
- If you are an Enterprise Customer with QA Access, we ask that you also perform this on QA using https://qa-player.telemetrytv.com and pairing to your QA environment.
Enable Debug Mode
In order to view detailed log information, we first need to enable debug mode.
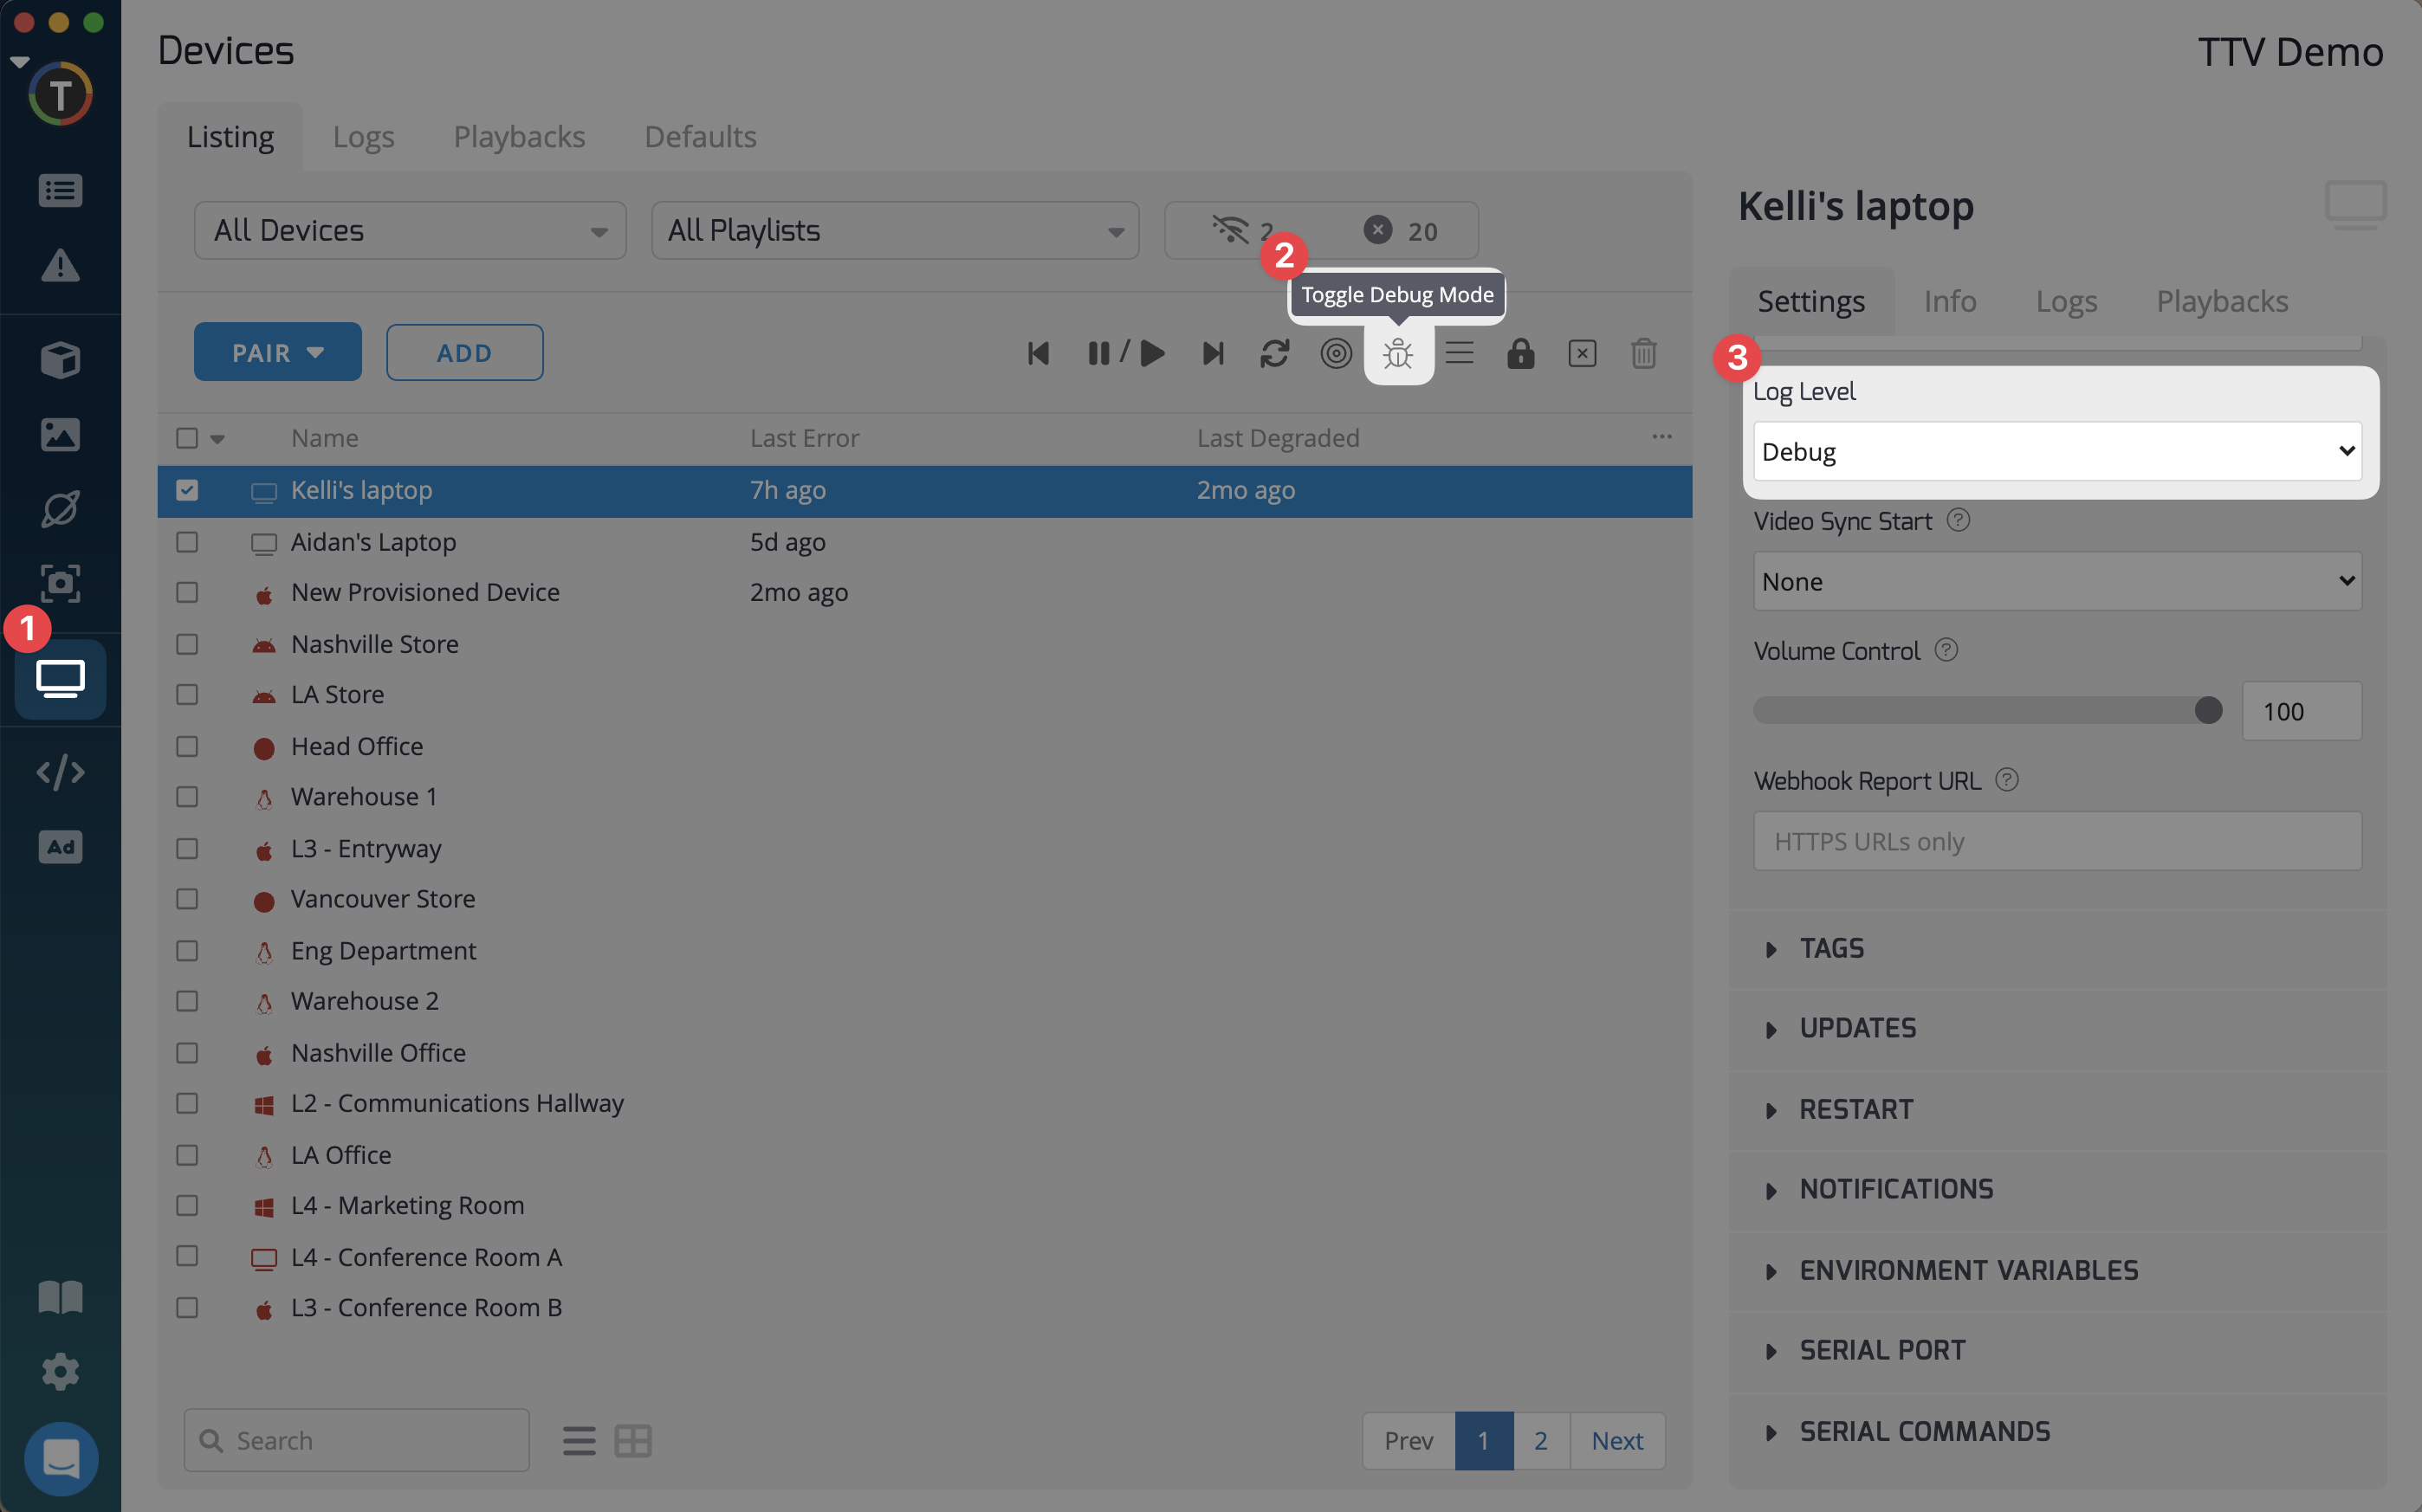
- Select the test device on your device list.
- In Settings tab, select Log Level, and set to Debug
- Click the Toggle Debug Mode icon in the top right to toggle debug on the browser test player.
Open the console
Go back to your tab with the test player open. Now, we need to open the console to look for any error messages.
- You can open the console (ctrl-shift-i or right click + inspect) and see what is going on. Of interest is the messages in the console.
- In the top section, select Application, then on the left expand Cache > Cache Storage > select videos.
- In the lower section, select Console to view console logs at the same time.
This is what your browser should look like (debug mode enabled on player, Application info in the top, console logs in the bottom). The Console may also open as a separate tab, depending on your screen size.
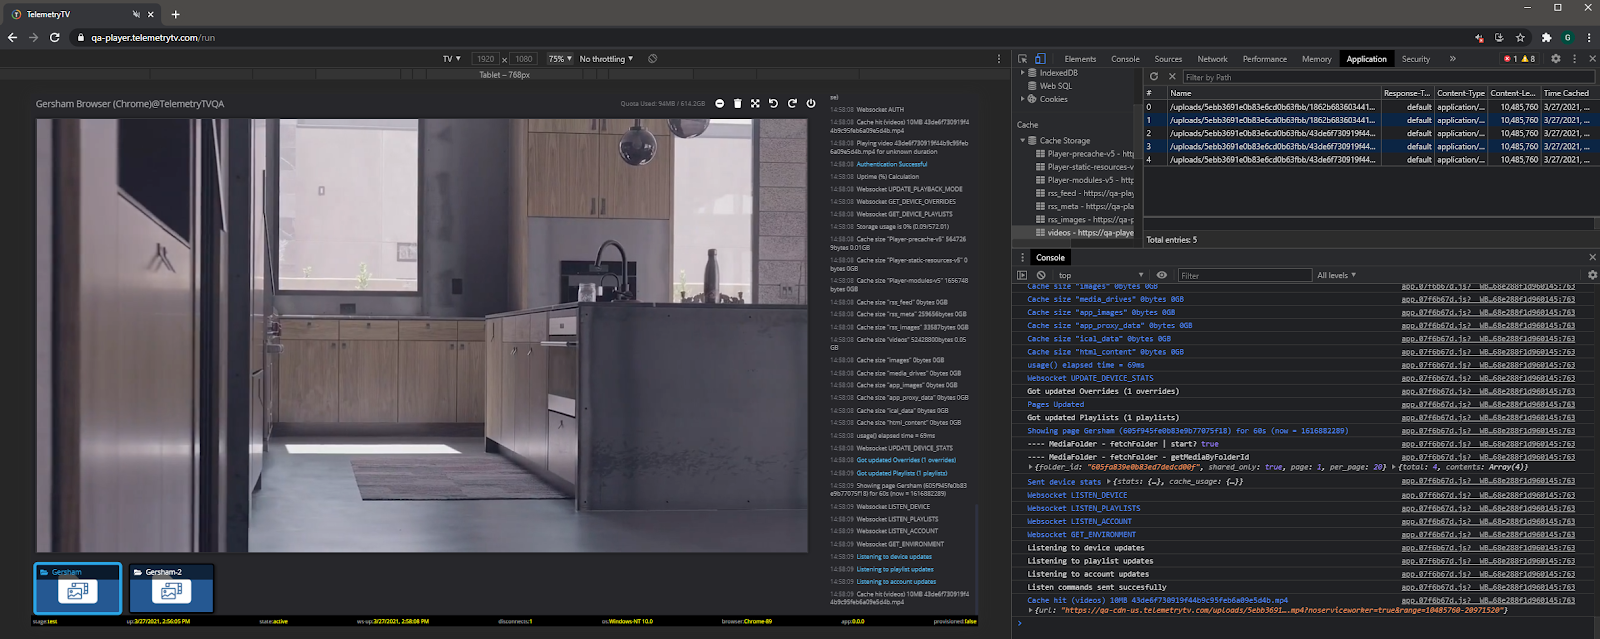
- Videos shows the videos that have been cached on the device (and will be available for offline playback).
- In debug mode, there will be a listing of the messages that are being logged on the device. Seeing this list of messages is crucial to understanding what’s going on.
Now, run the playlist with these items open. Once you can reproduce the issue on the browser, send a full screenshot of what it says in the debug logs and the console logs. This should identify what errors are occurring when the issue appears.
Device Cache Logs & Cache Miss Rate
For video caching issues, we also ask that you look into your device logs and cache miss rate to identify how the device is handling caching.
In the Logs
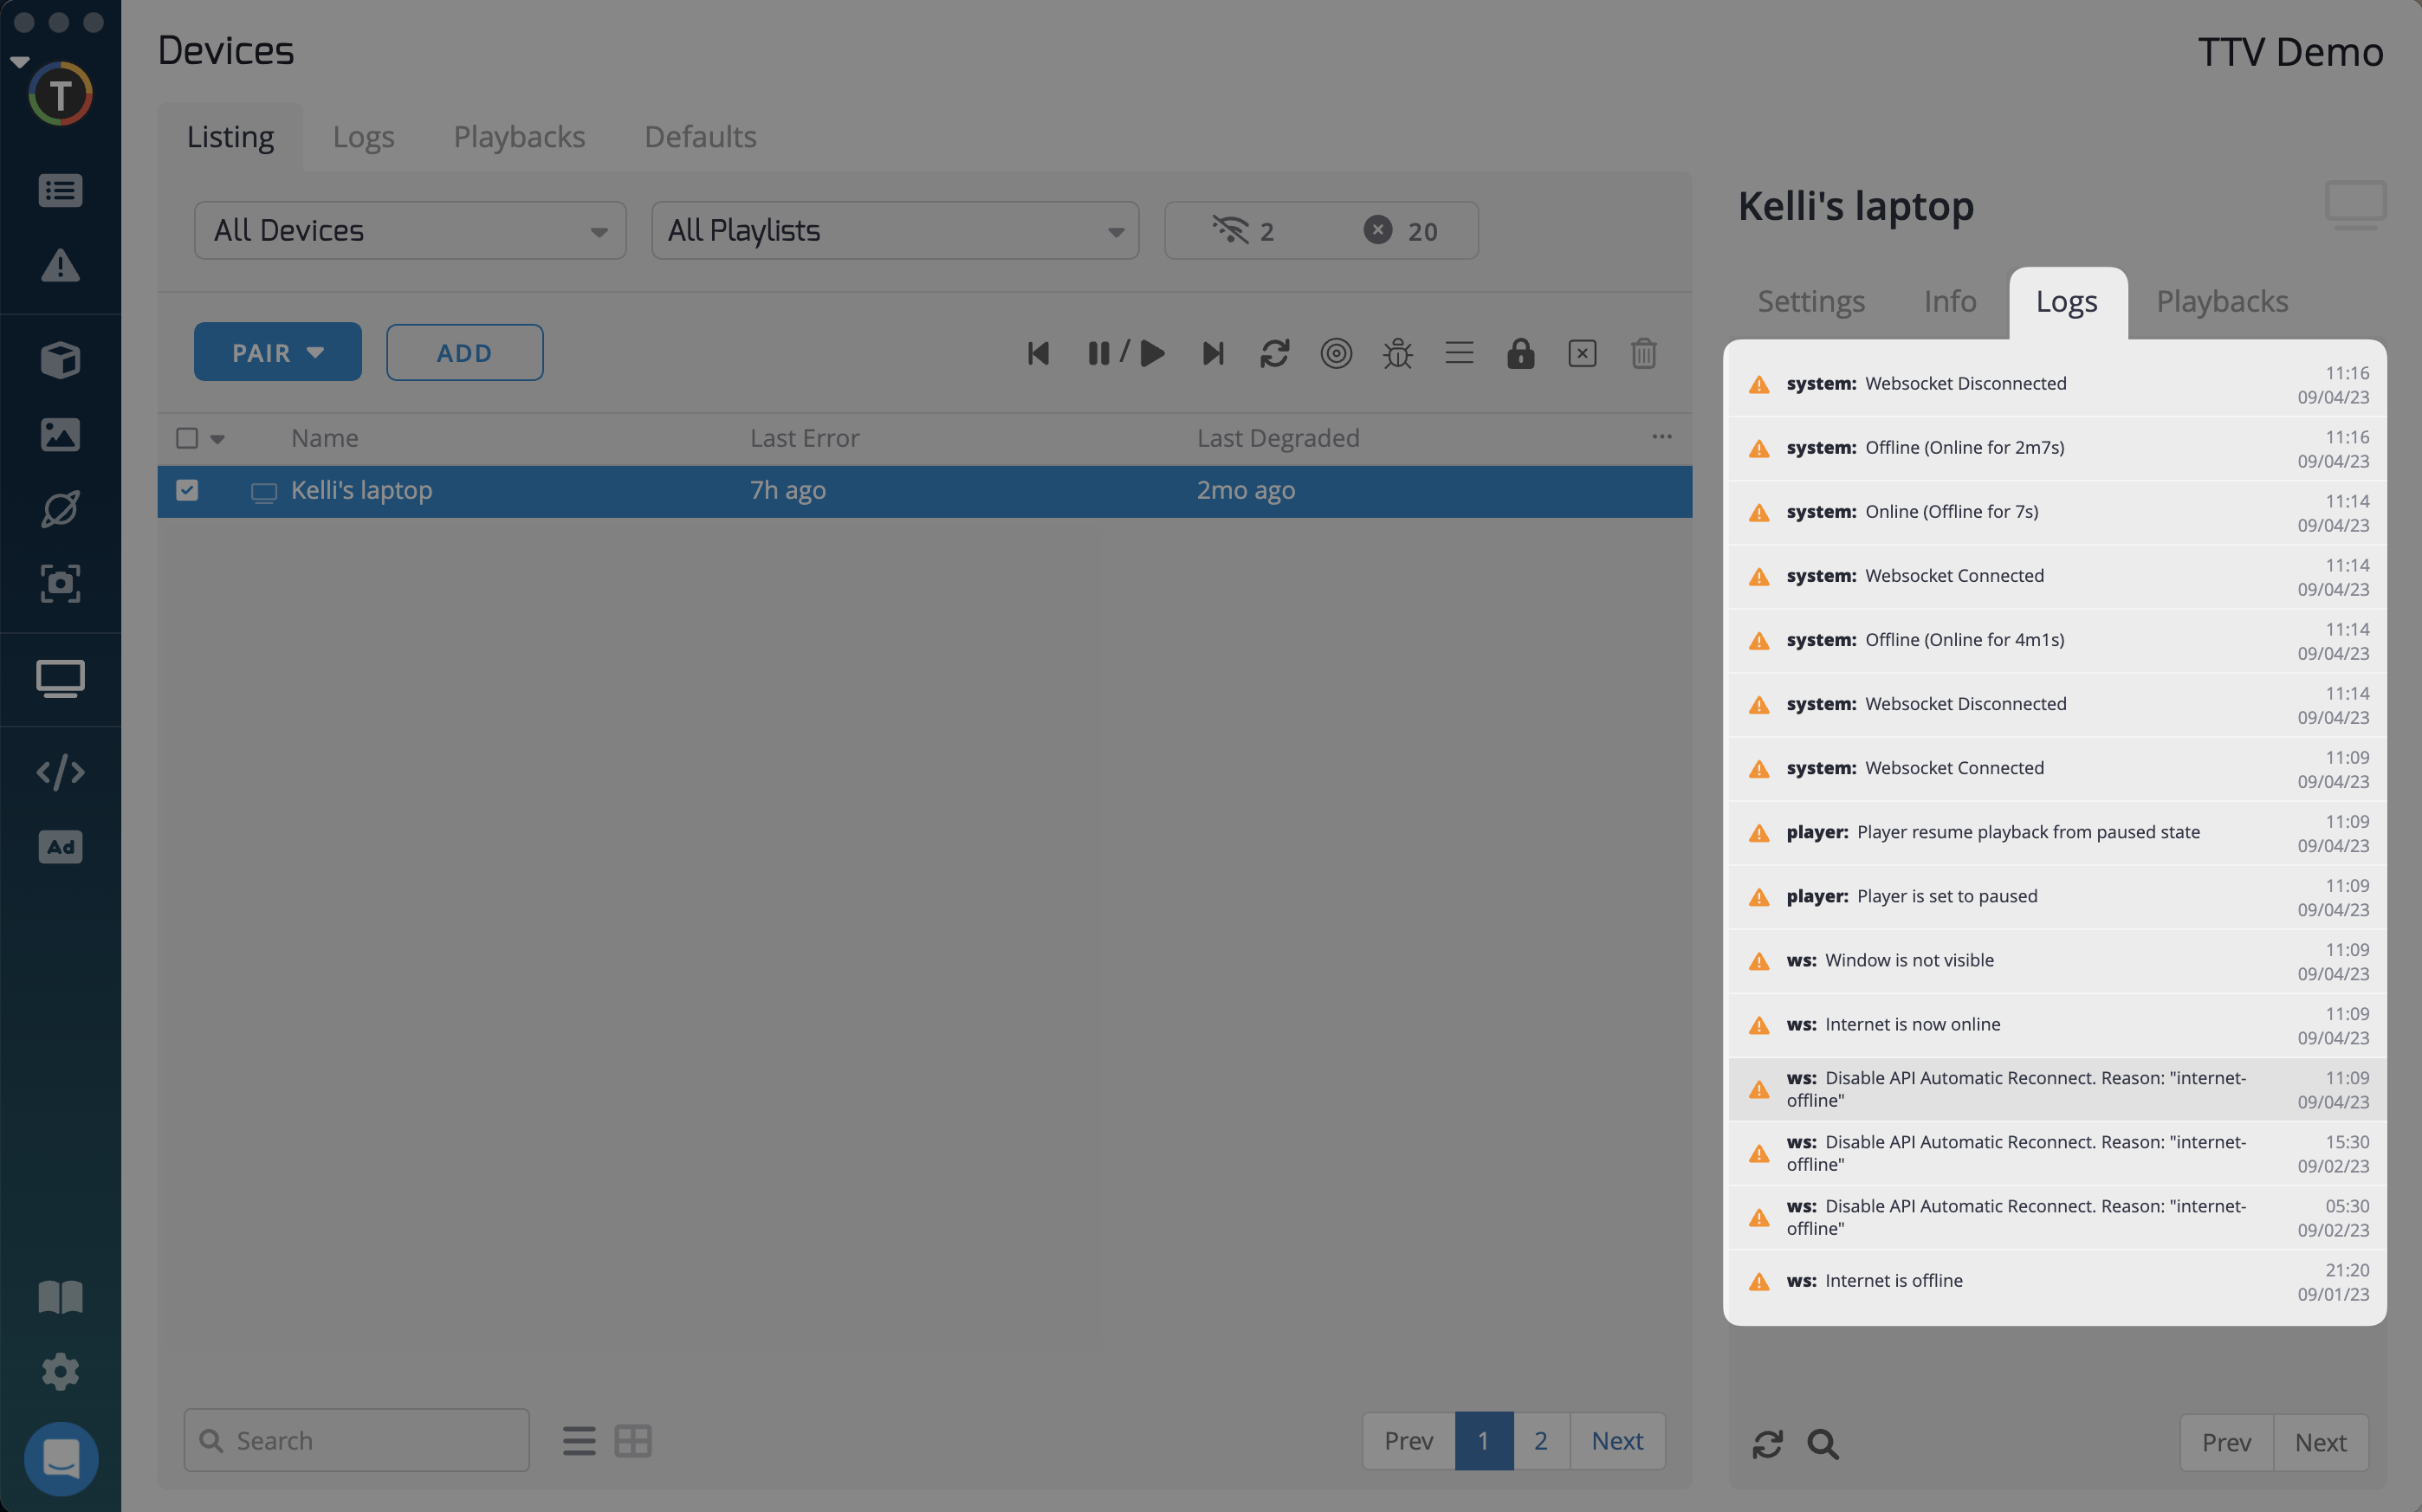
With debug logs set, you can select the Logs tab on the devices page and use the search bar to search for cache.
- You’ll see hits and misses. You want cache hits, as this means the video is in the cache. A miss means that the player needs to go out to the network to get the file, which should only happen once for a video.
Cache Miss Rate
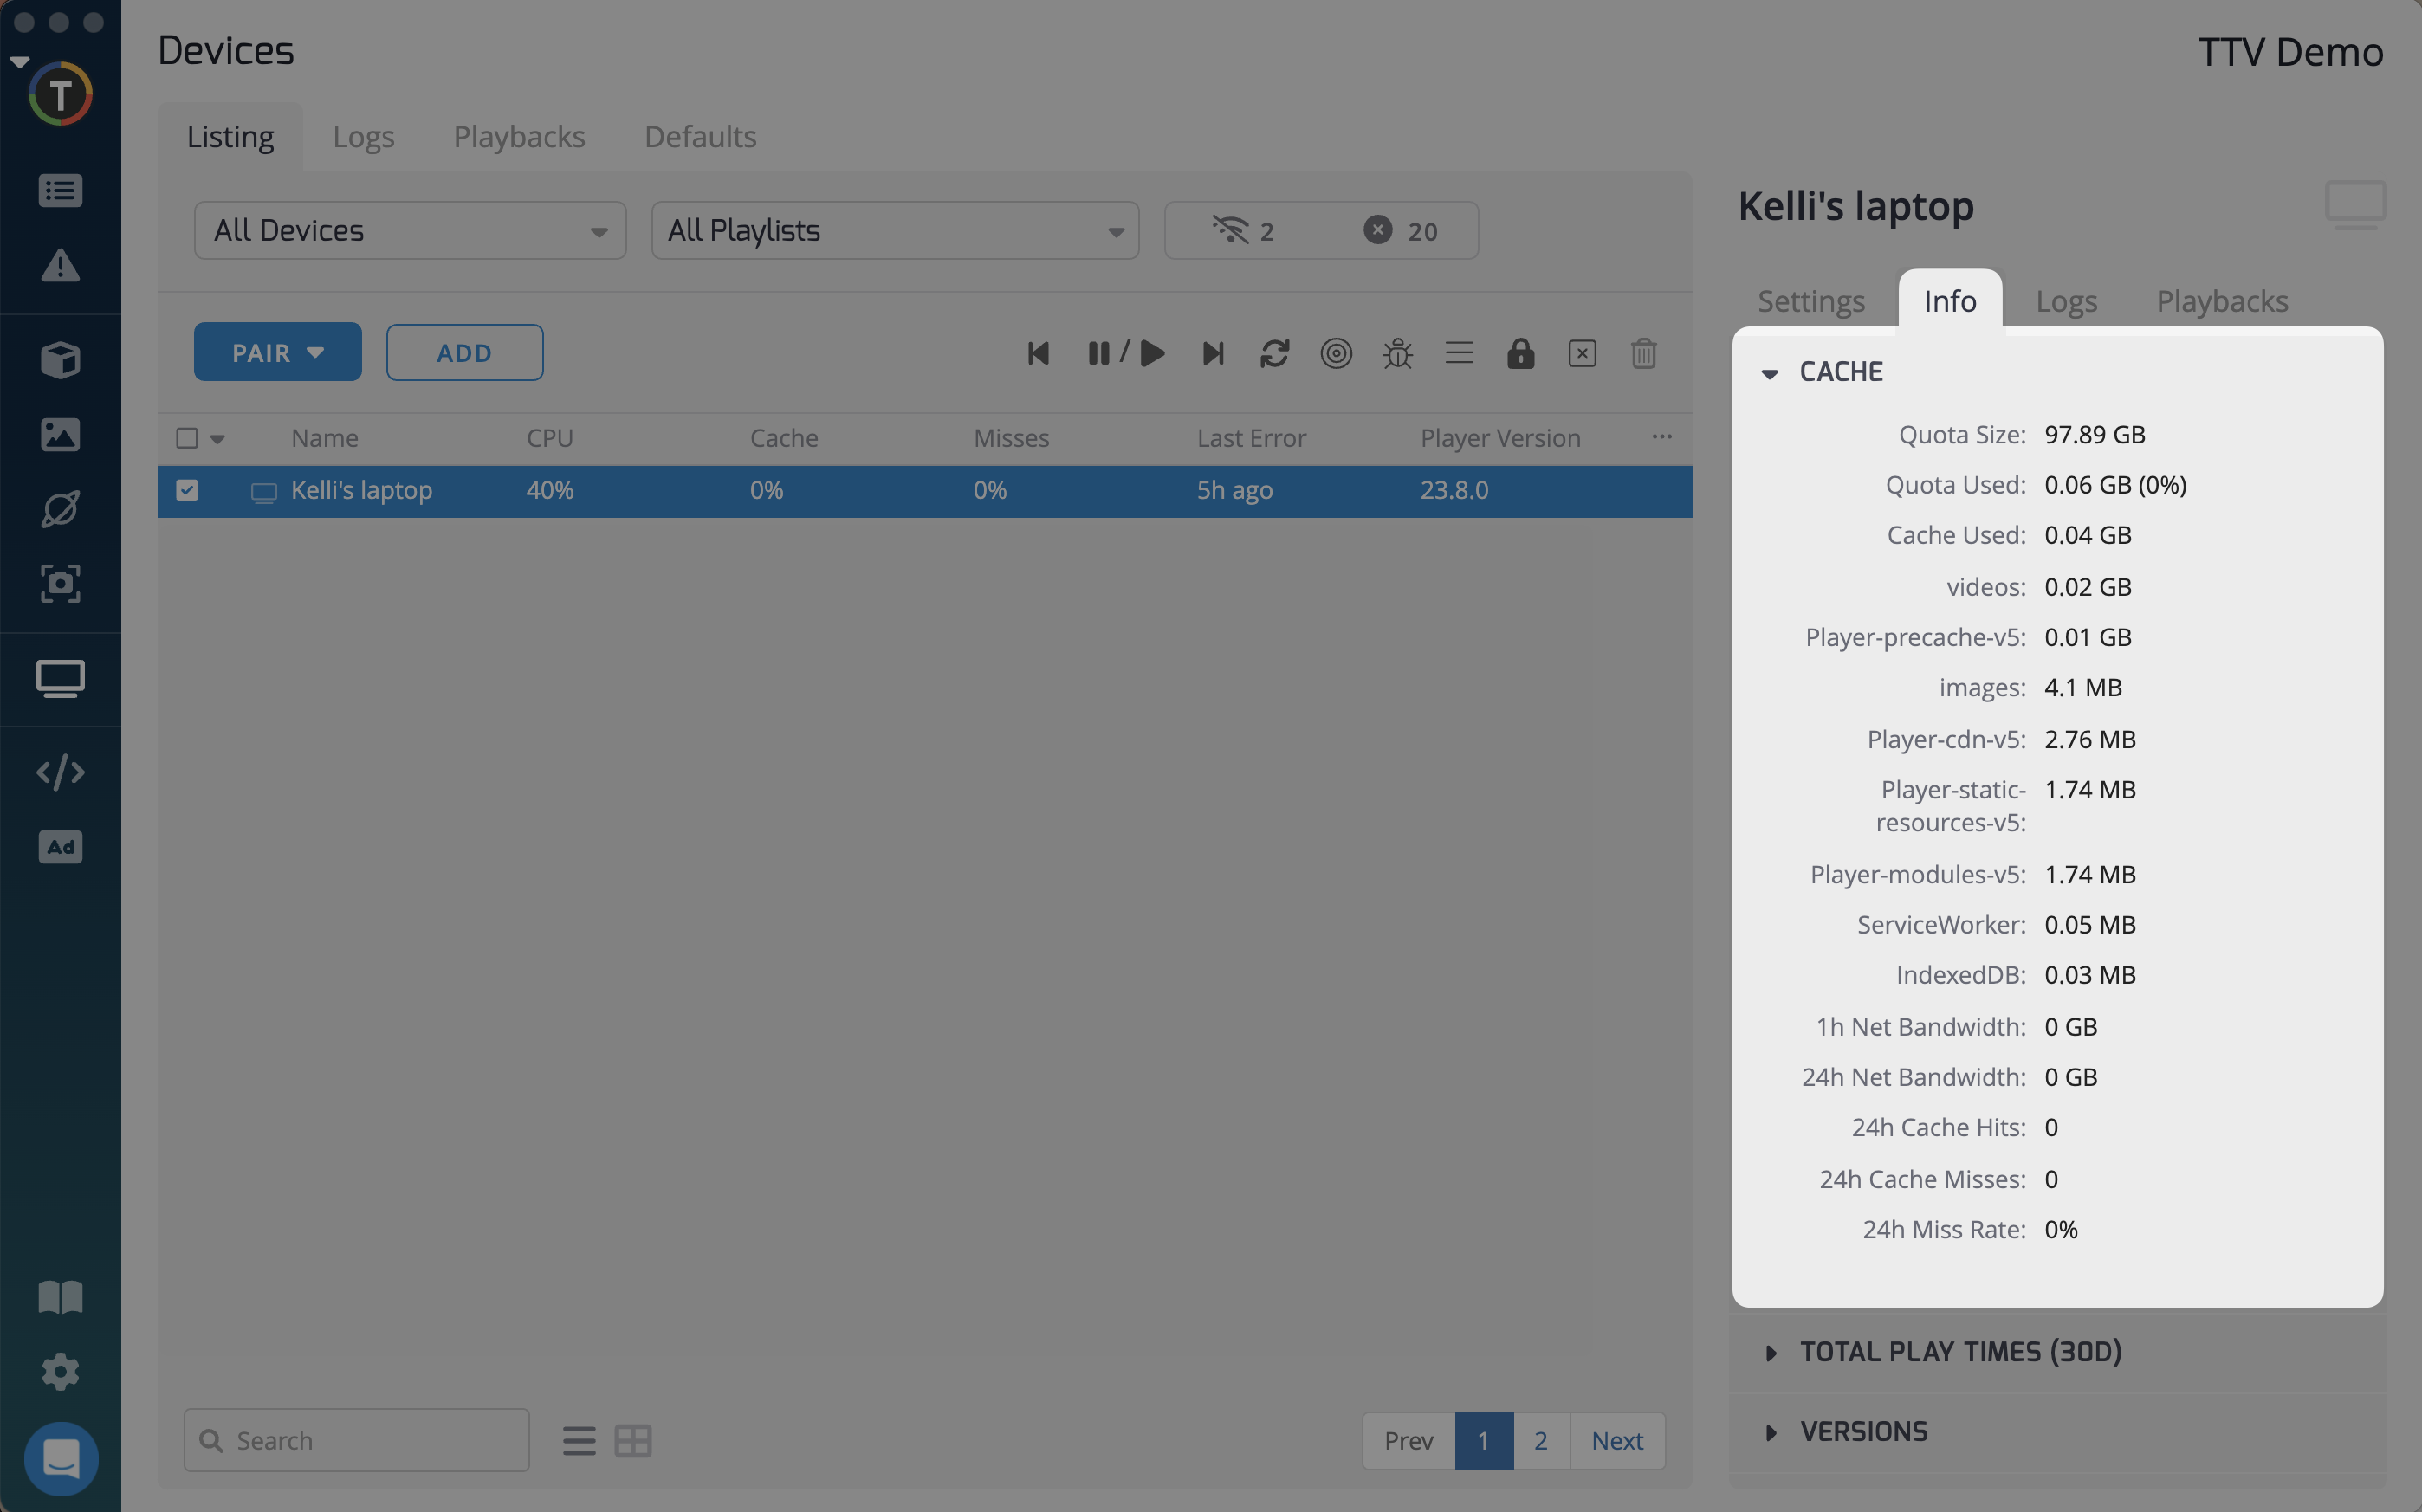
Under the Info tab you’ll see the cache miss rate, which indicates the percentage of requests that were misses. This should ideally be as close to zero as possible, so it’s important to keep an eye on it.
Reporting the Issue
Please include the following information and send in a Support ticket to TelemetryTV:
- Description of Symptom
- Note date/time
- Note duration of symptoms
- Trigger of Symptoms (events that lead up to symptom)
- Note level of impact (# of devices showing symptoms)
- Device Type (Android, Chrome model no., Browser + Version, etc)
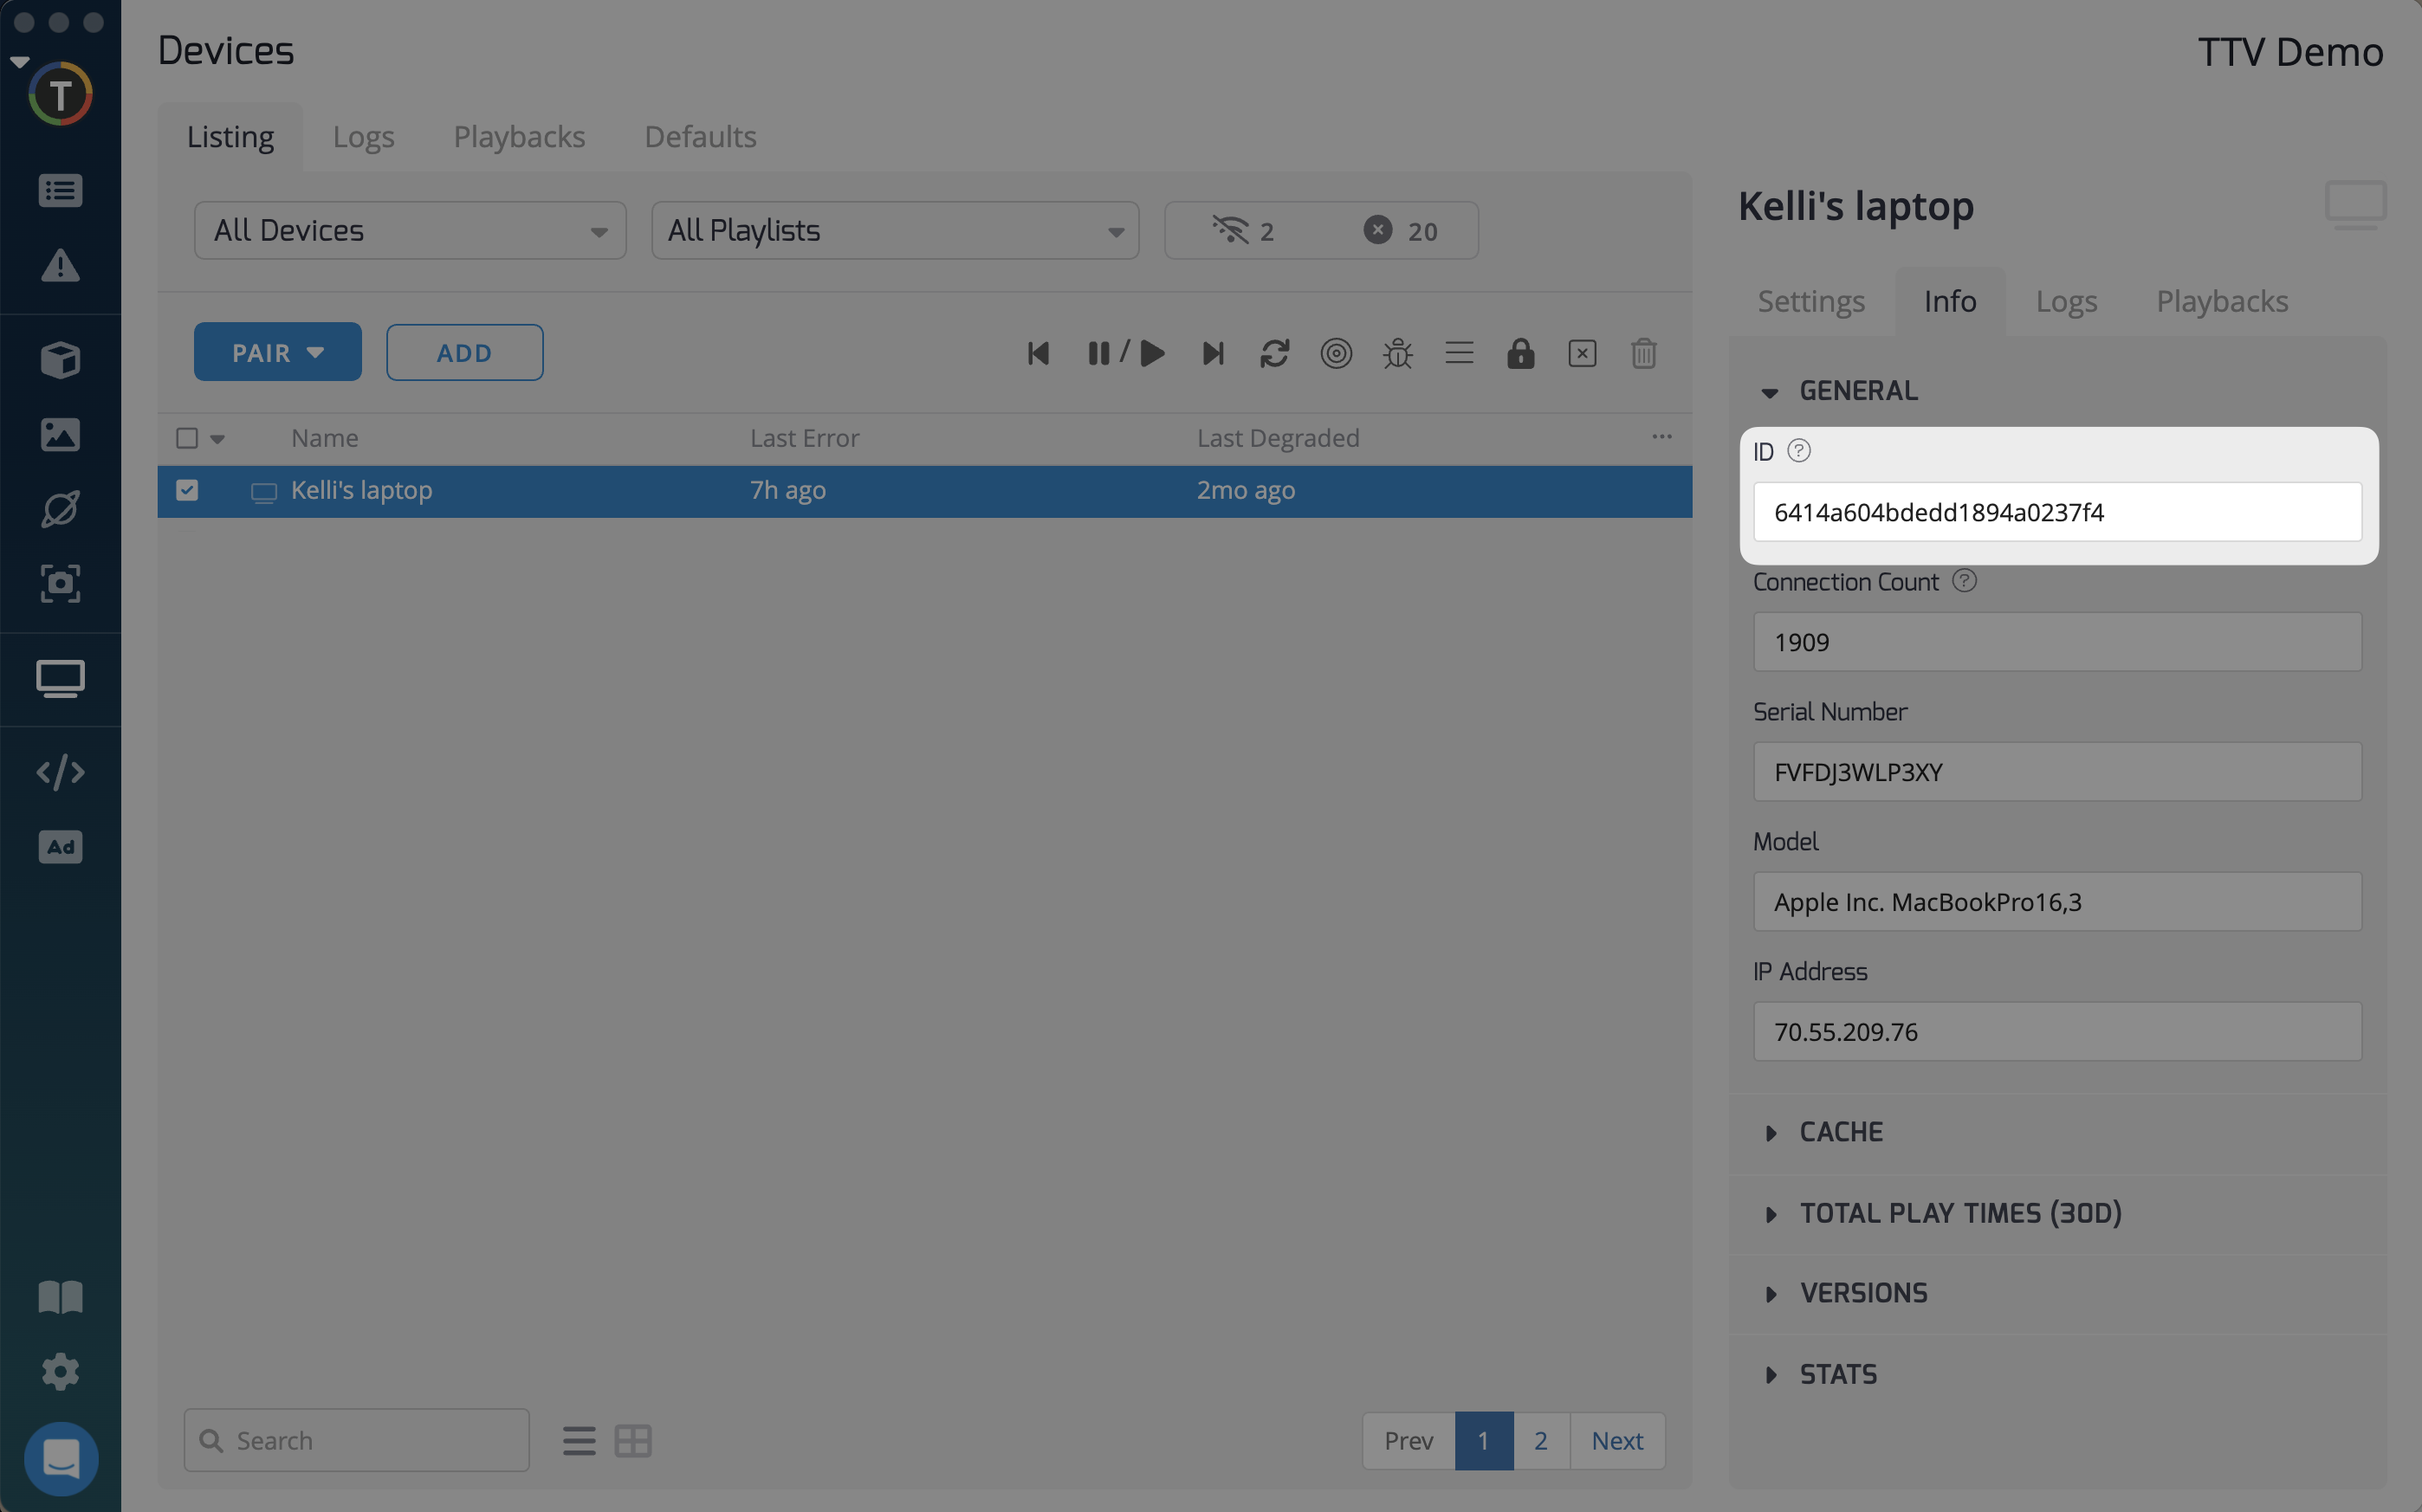
- Device ID (device page > select device > copy ID from URL)
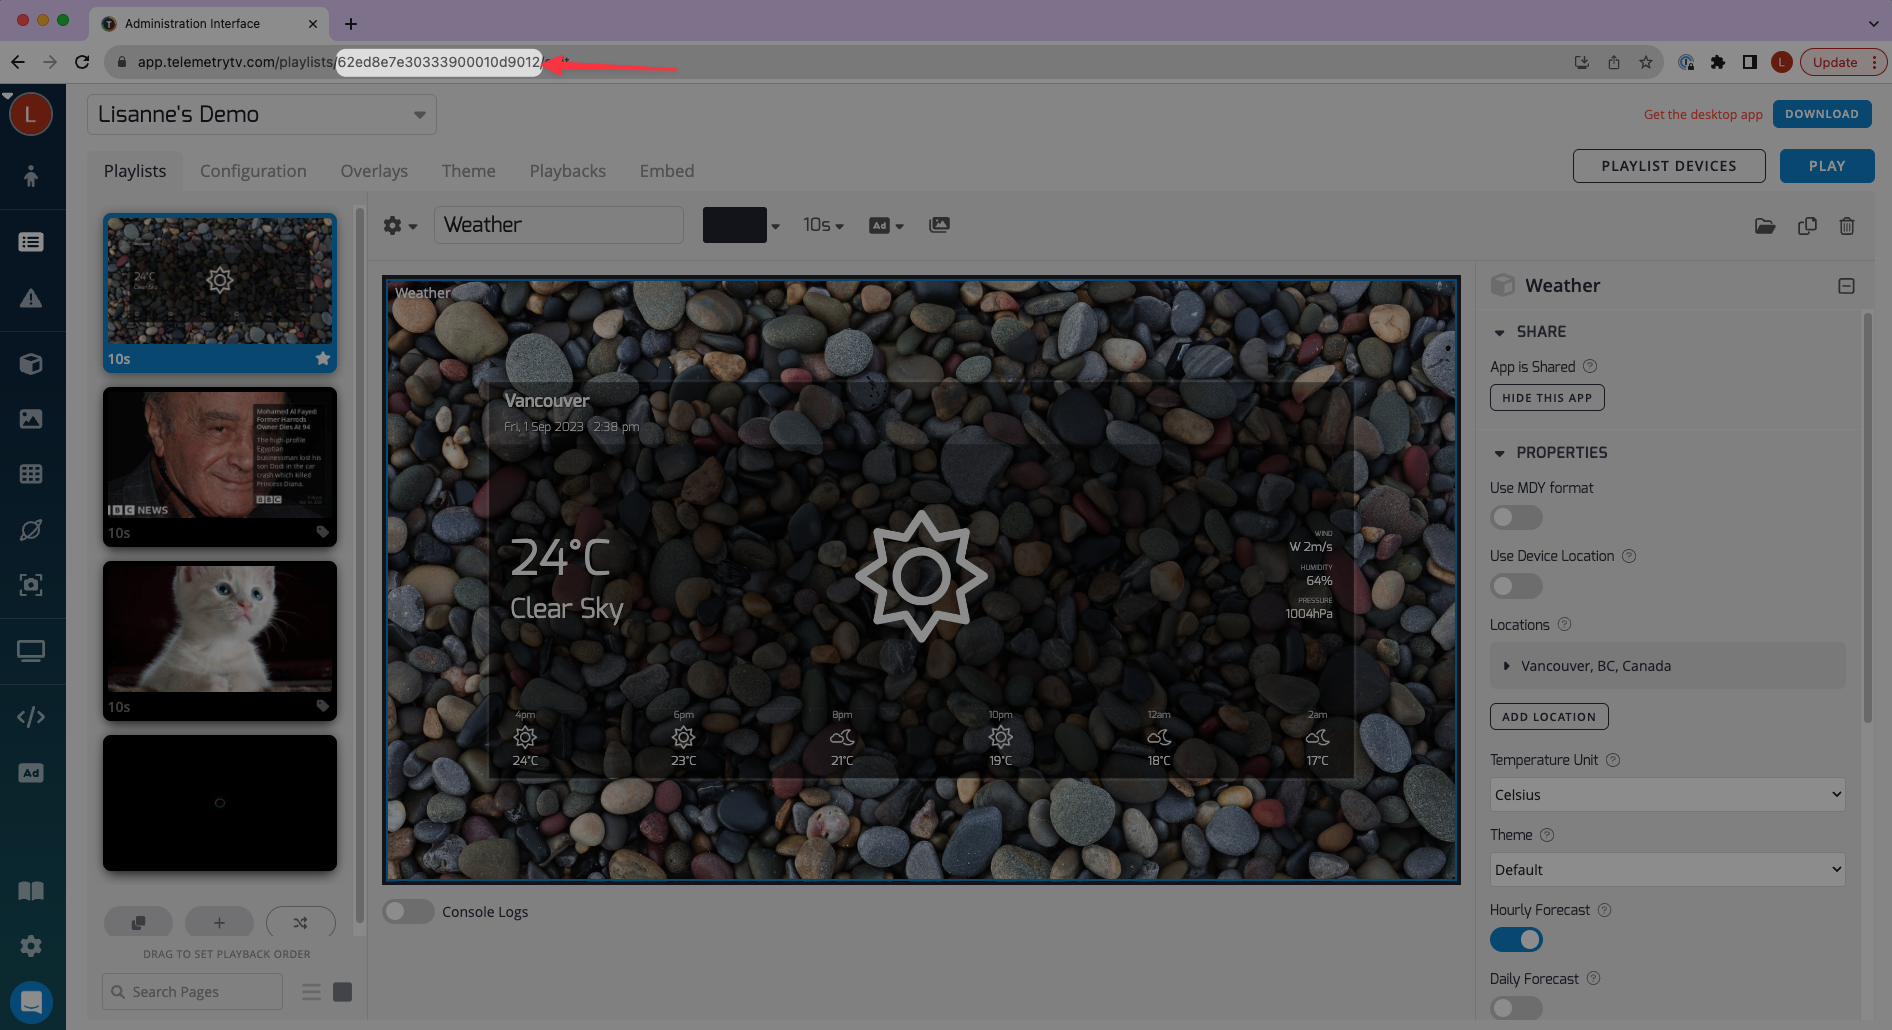
- Playlist ID (go to playlist > copy ID from URL)
- Media Player Version/Environment
- TelemetryApp Version/Environment
- Chrome Version
- Screenshot(s) of debug logs / device logs (see above)
- Screenshot(s) or photos of error messages/issues seen on device screen
Finding Device ID
Finding Playlist ID
Chromebox Logged out
If you have been logged out of the Chromebox it usually means that Kiosk Mode has been exited.
To log back in, you need to contact Google Support to set the device(s) back into Kiosk Mode to work with the TelemetryTV application.
TelemetryTV is only the app running on the device(s), and have nothing to do with any configuration on the Chromebox itself.
Using Chrome Browser as my TV Display
How can I set up Chrome browser as my display for TVs using TelemetryTV?
To use our progressive web application (browser-based player) with Chrome browser as your display, please visit https://player.telemetrytv.com/.
For longer-term use, we recommend Provisioning.
- You can do so by navigating to Settings
- Select the Provisioning option.
- Then Create a provisioning token, and copy the URL into a browser to provision your devices.
Any devices you connect to your account will be automatically detected by our billing system and added to your subscription after 6 hours.
Video Freezing During Upload
If your video is freezing during upload or playback on TelemetryTV, follow these steps to troubleshoot the issue:
Check Format and Codec: Ensure the video is in MP4 format with the H.264 codec. Re-encode it using tools like HandBrake if necessary.
Optimize Resolution and Bitrate: Use 1080p resolution (1920x1080) with a bitrate of 8-10 Mbps to ensure smooth playback, especially on less powerful devices.
Verify Upload Stability: Ensure your internet connection is stable. Compress large files before uploading if the process freezes.
Test Playback Devices: Restart the playback device and confirm it meets TelemetryTV’s hardware requirements. Test the video on another device to isolate the issue.
Check Network Performance: A minimum download speed of 5 Mbps per screen is required for reliable streaming. Verify your network can handle the load.
Validate in Media Library: Use the preview feature to ensure the video was uploaded correctly and plays smoothly.
Updated 6 months ago