Monitoring Health
Understanding icons and tabs on the devices page
The devices page illustrates a number of attributes about your devices paired or provisioned to your account.
Columns (Left to Right)
Key Metrics/Indicators
| Name | Description |
|---|---|
| Device is green, red or grey | Device is online or offline |
| Name | Device name |
| Content | The type of content |
| Asset ID | Asset ID number |
| Serial No. | Serial ID number |
| Uptime% | Percentage of time your device is up and running over the last 30 days |
| Uptime | Consecutive time your device has been online |
| Reconnects | Number of time the device has reconnected to the network |
| Err Msgs | Number of error messages displayed for that device (you can see the error details by searching the in the logs tab with the keyword "error") |
| CPU | % of device CPU occupied during playback |
| Mem | % of device memory occupied during playback |
| Cache | % of server cache storage allotted to that device that's been filled |
| Misses | A percentage of any misses during playback |
| GB Data | Data usage in Gigabytes |
| Last Error | Time of the last error recorded |
| Last Degraded | Last time the device was degraded |
| App Version | App version number |
| Player Version | Player version number |
| Release Channel | The release channel if applicable |
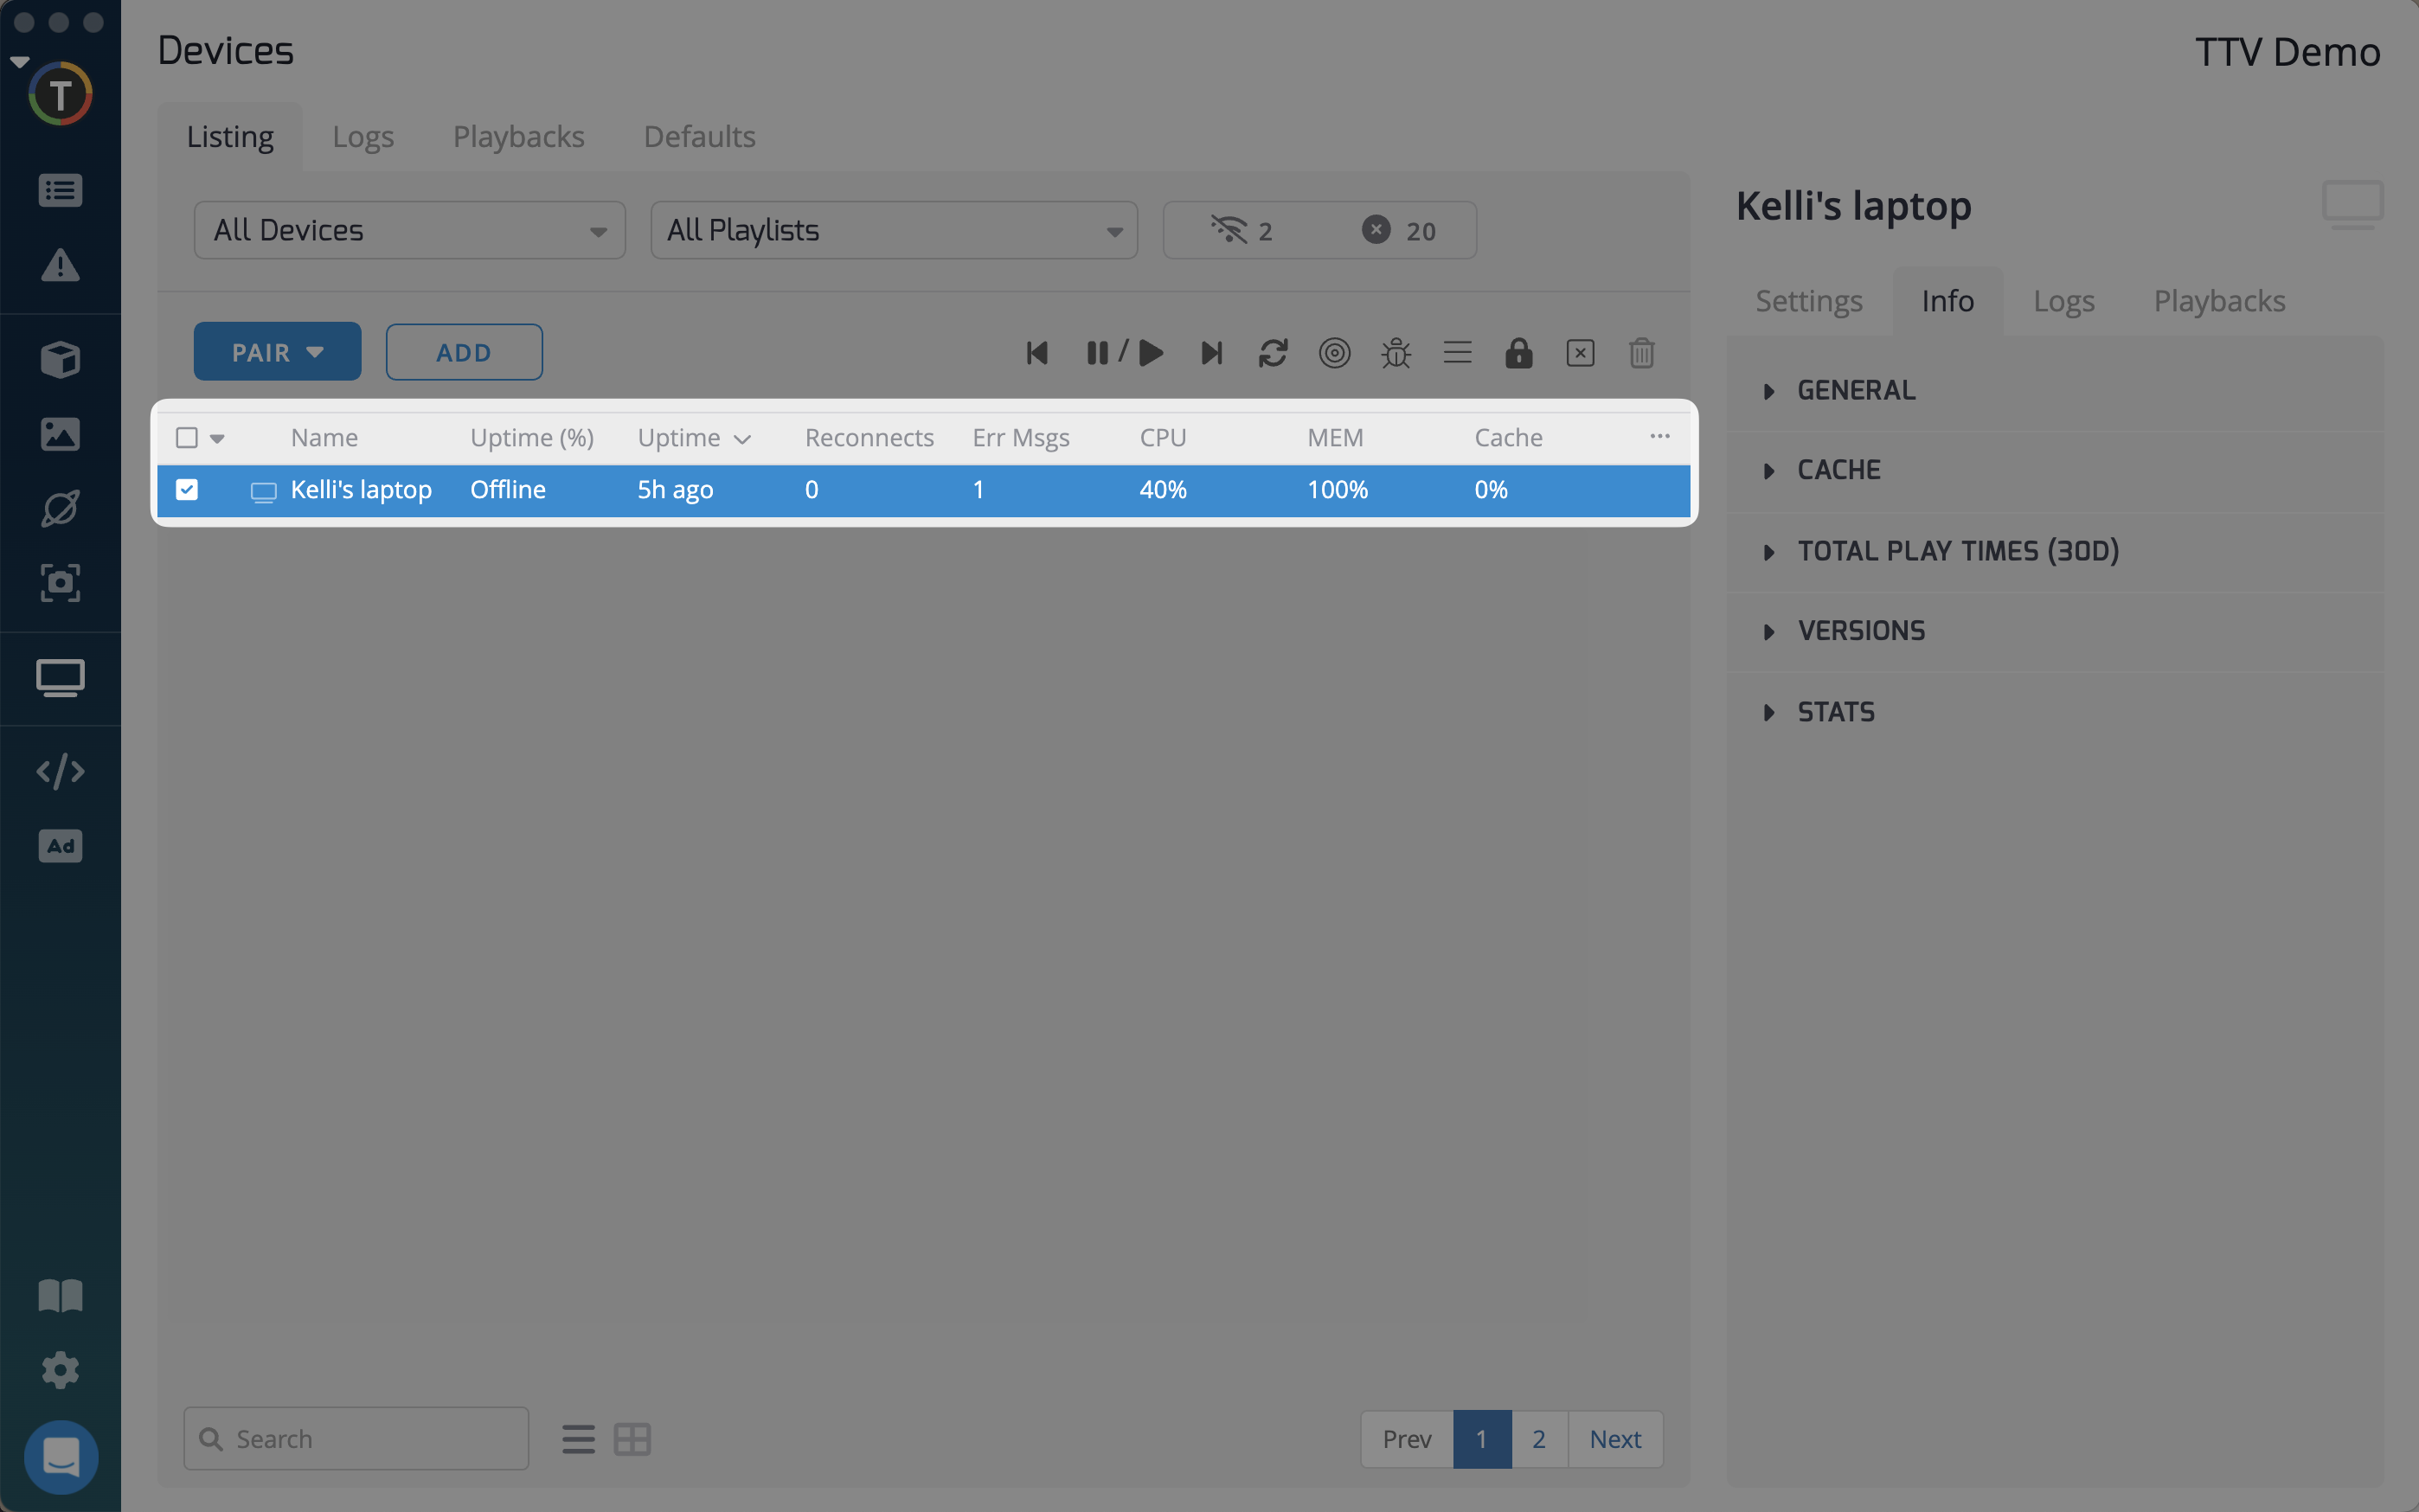
You can also customize these columns by clicking the ... icon at the right of the listing.
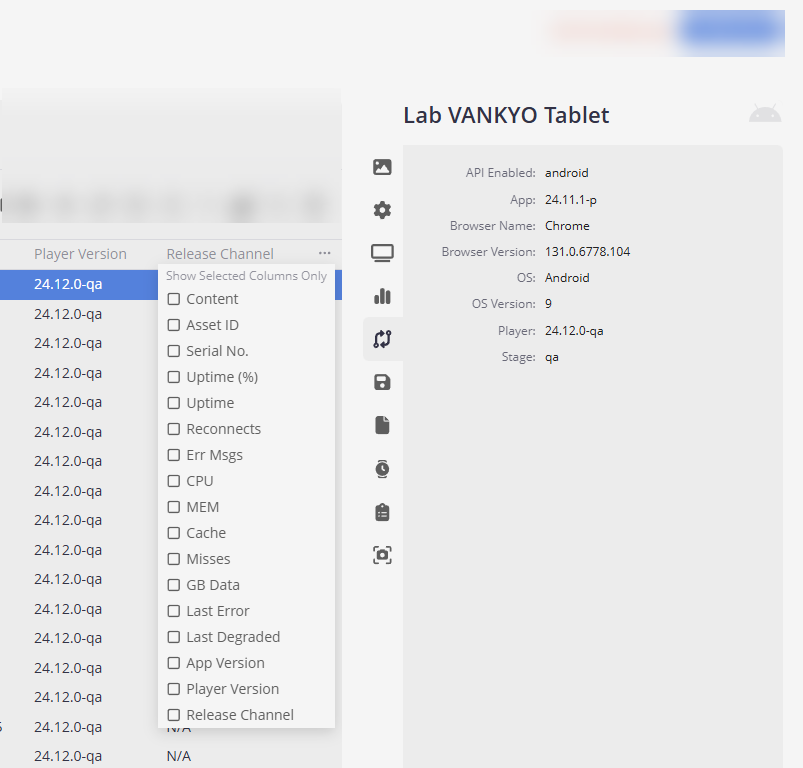
Special icons
If you see a caution triangle icon instead of a percentage, this means your device has had to reconnect >500 times in the last 30 days.
Device Information
To the right of the devices dashboard is a menu containing various menu options showing more detailed device information, including device stats, logs, and playback records.
Content
All content information for this device.
| Name | Description |
|---|---|
| Playback Mode | Choose a playback mode for your device |
| Playlists | Assign multiple playlists to a device |
| Add Playlist | Select a playlist to add to this device |
| Active Window | Stop playing the playlists outside the defined timeframe |
| Show Interactive Menu | Show the interactive menu on the device by default |
| Tags | Add a tag for this device |
| Environmental Variables | Enter a new environmental variable using a variable key and value. |
Settings
The Settings tab show a variety of information about your device:
| Name | Description |
|---|---|
| Playlists | Lists the playlists currently paired to the device, including the option to edit these |
| Description | Device description |
| Location | Device location |
| Organization | Which organization the device belongs to (learn more about device organization) |
| Language | The device language, either 'Account Default,' or specific to that device |
| Log Level | Detail level of the logs generated for the device. There are four different levels: Debug, Info, Alert/Warning, and Error. These will be further described in the Logs section below |
| Tags | Descriptors used to identify devices quickly when searching |
| Notify on Offline | Turn this on to receive email notifications when the device goes offline |
| Notify on Play Failure | Turn this on to receive an email notification if the device does not play the next page within 60 seconds |
| Environmental Variables | Allows for selective playlist page display (learn more about environmental variables here) |
Device
The Device menu option provides detailed information about the device:
| Name | Description |
|---|---|
| Device ID | A unique identifier generated by our system |
| Connection Count | Shows how many times the device has connected to the websocket server |
| Versions | Displays information about the operating system, and TelemetryTV App version being used on that device |
| Serial Number | Serial number from this device |
| Model | Model name of this device |
| IP Address | The device IP address |
| Update Button | Start to update this device immediately |
| Schedule Restart | Restart the device at the scheduled time once a day |
| Notify on Offline | Send a notification if the device has been offline for more than 60 seconds |
| Notify on Playback Failure | Sends a notification if there has not been a playback after the defined time window |
| Enable Serial Port Connection | Enables the serial port connection for this device |
| Enable Serial Commands | Enables the serial commands feature for this device |
| Log Serial Command Responses | Enable this to log all serial command responses |
Statistics
A list of all statistics for this device.
| Name | Description |
|---|---|
| CPU Load % | The current CPU load on this device |
| CPU model | The model of the device CPU |
| Device Manufacturer | The device manufacturer name |
| Device Model | The device model name |
| Device Serial Number | The device serial number |
| Errors Count | The number of errors counted for this device |
| Hostname | The device hostname |
| IP Address | This device IP address |
| MAC Address | This device MAC address |
| Memory Free (%) | The total memory free as a percentage |
| Memory Free (MB) | The total memory free as a percentage |
| Memory Total (MB) | The total memory in Megabytes |
| Memory Used (%) | The total memory used as a percentage |
| Memory Used (MB) | The total memory used in Megabytes |
| Monthly Bandwidth | Your allowed monthly bandwidth for this device |
| Network Access | Type of network access (typically wifi) |
| Number of Displays | The number of displays used |
| Orientation | Screen orientation (landscape or portrait) |
| Platform | Operating system used |
| Platform Version | The Operation System version number |
| Reconnects Count | The number of reconnects for this device |
| Screen Browser Height | The height of the browser used |
| Screen Browser Width | The width of the browser used |
| Screen Physical Height | The actual screen height |
| Screen Physical Width | The actual screen width |
| Serial Ports | Lists all used serial ports for this device |
| Storage Free (MB) | The device storage free in Megabytes |
| Storage Total (MB) | The total device storage in Megabytes |
| TelemetryTV Box OS Version | The TelemetryTV Box OS version number for this device |
| Uptime App (S) | The uptime app in seconds |
| Uptime Player (%) | The uptime player percentage |
| Uptime Player (S) | The uptime player in seconds |
| Uptime Unreliable | If any uptime has been unreliable (true or false) |
Versions
The current version information for this device.
| Name | Description |
|---|---|
| API Enabled | Name of the API currently enabled |
| App | App version number |
| Browser Name | Name of the browser used by the device |
| Browser Version | Device browser version number |
| OS | Name of the Operating System used |
| OS Version | Current version number of the Operating System used |
| Player | Player current version number for this device |
| Release Channel | A release channel for this device |
| Stage | What stage is used for this device |
Cache
All cache information for this device.
| Name | Description |
|---|---|
| Quota Size | How much storage is used by quota size (GB) |
| Quota Used | How much storage is used by quota used as a GB percentage |
| Cache Used | How much storage is used by the cache (GB) |
| videos | How much storage is used by video data (GB) |
| images | How much storage is used by image data (GB) |
| Player-precache-v5 | How much storage is used by player precache data (GB) |
| rss_meta | How much storage is used by RSS meta data (GB) |
| Player-static-resources-v5 | How much storage is used by app proxy data (MB) |
| rss_images | How much storage is used by RSS images (MB) |
| hourly_data | How much storage is used by hourly data (MB) |
| rss_feed | How much storage is used by RSS feed (MB) |
| app_proxy_data | How much storage is used by app proxy data (MB) |
| ServiceWorker | How much space is used by the service workers (MB) |
| IndexedDB | Storage used by Indexed database (MB) |
| 1h Net Bandwidth | The net bandwidth used in a 1 hour period (MB) |
| 24h Net Bandwidth | The net bandwidth used in a 24 hour period (MB) |
| 24h Cache Hits | The number of cache hits in a 24 hour period |
| 24h Cache Misses | The number of cache misses in a 24 hour period |
| 24h Miss Rate | The miss rate over a 24 hour period as a percentage |
Logs
From the Logs menu, you may view a recent history of your device's offline/online status. A caution triangle icon signifies an offline event, while an info circle icon signifies an online event.
Log entries stay saved in our database for 30 days.
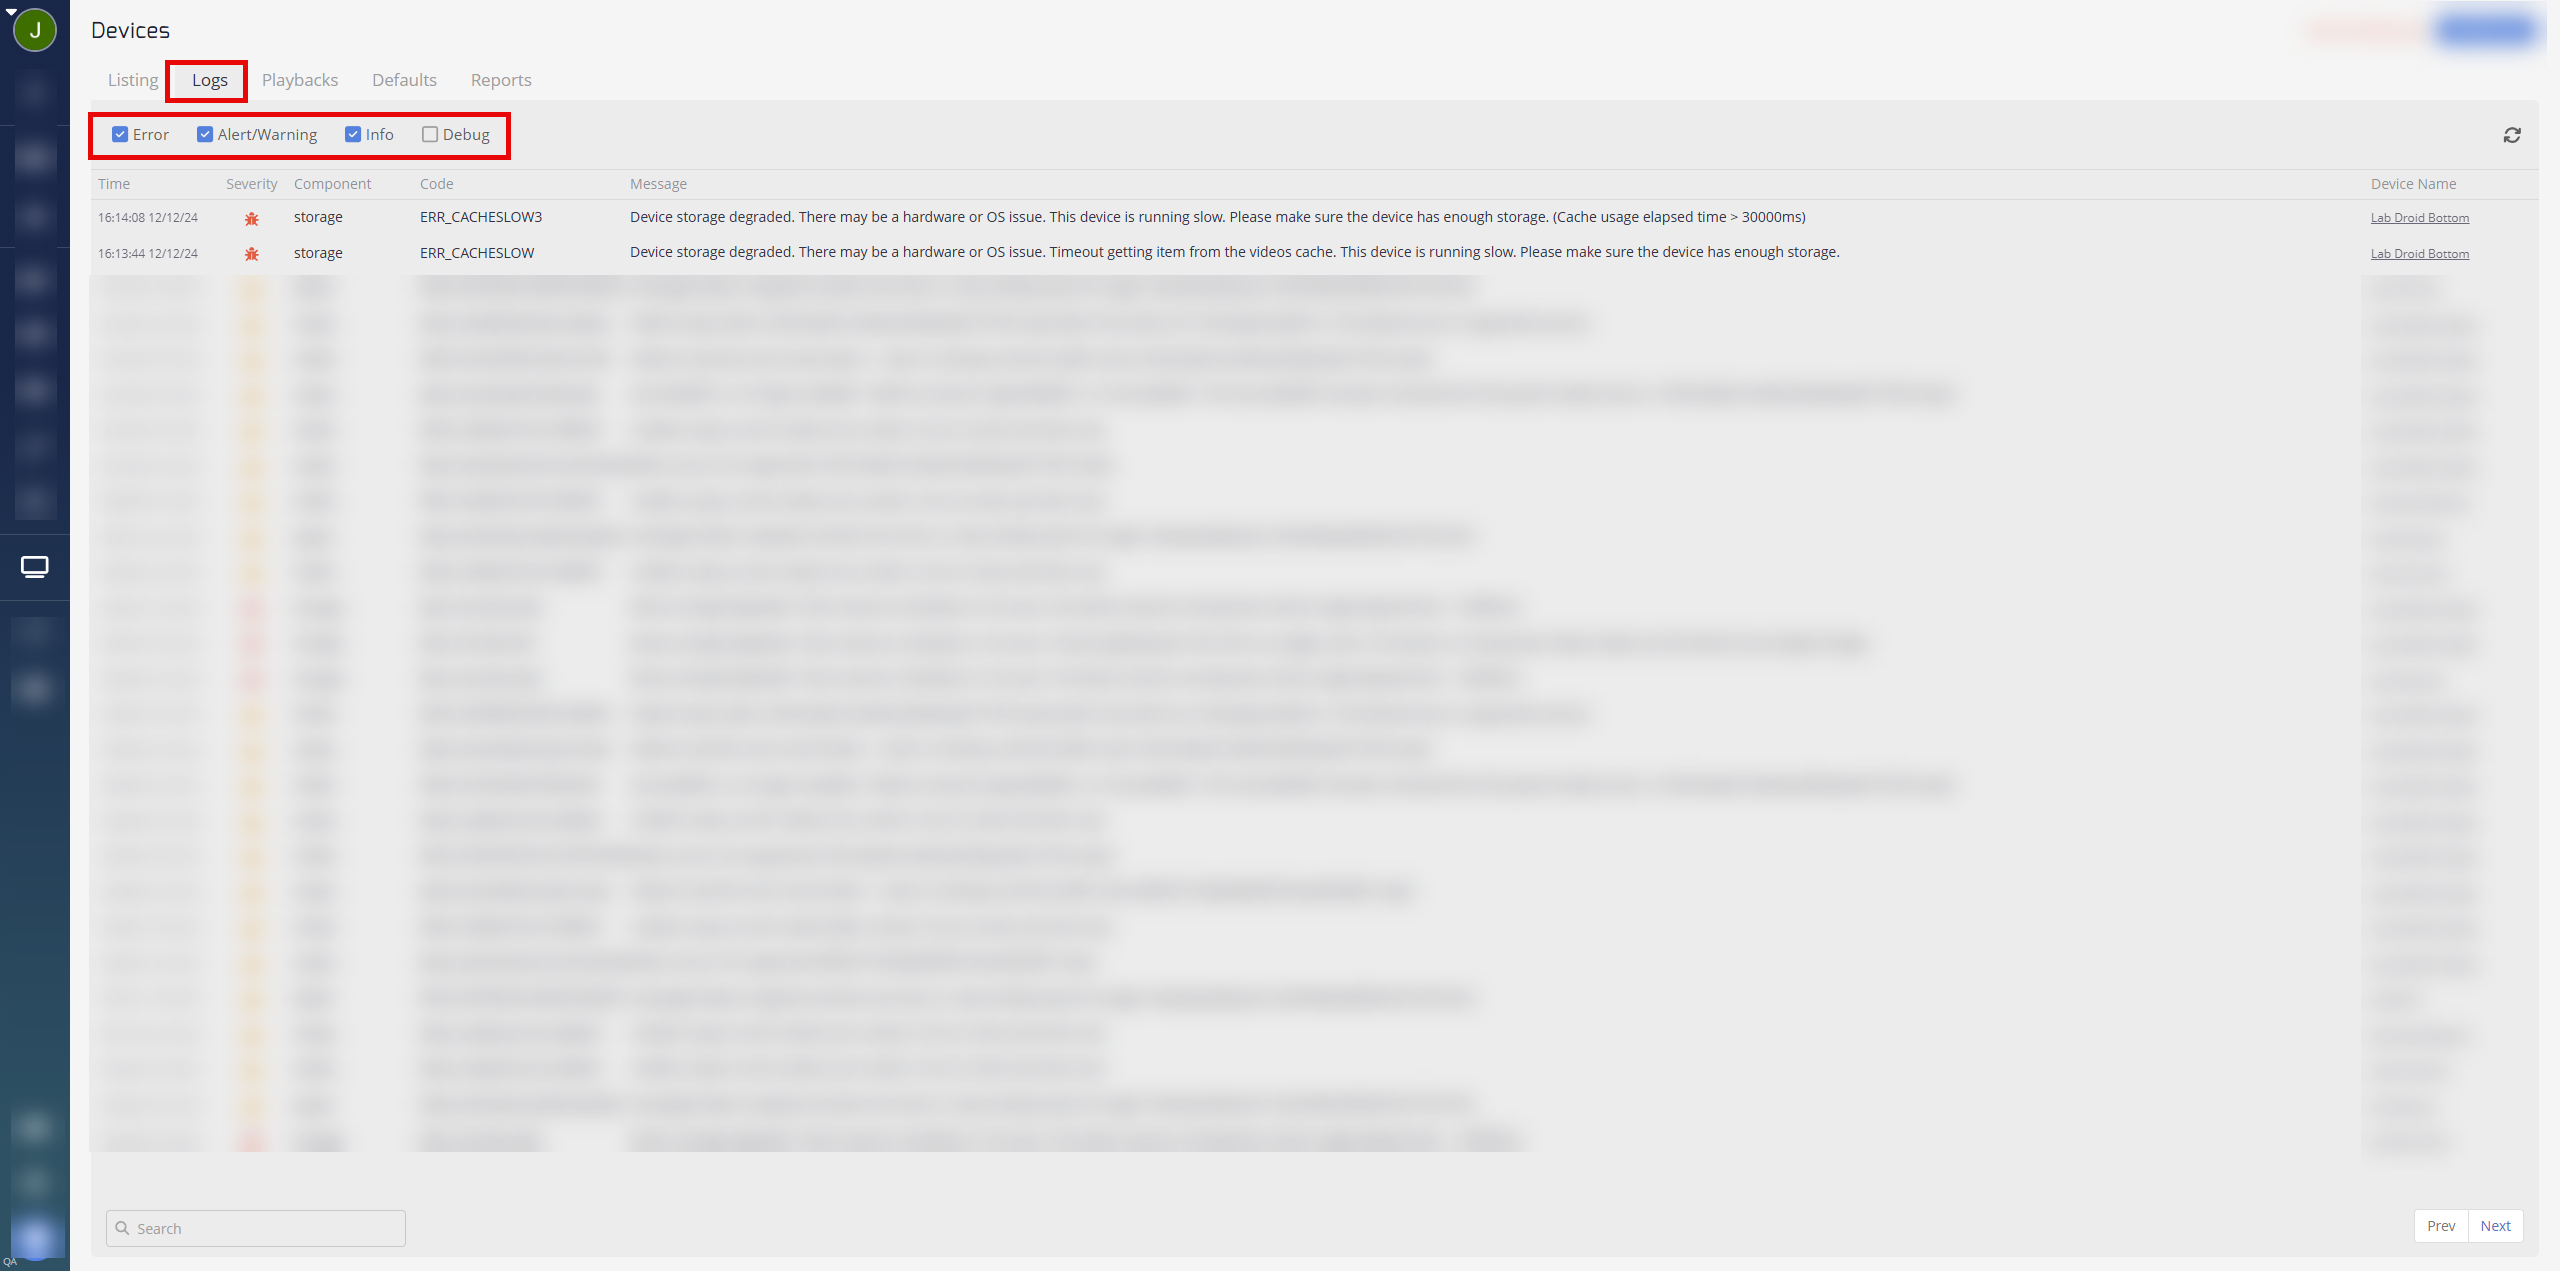
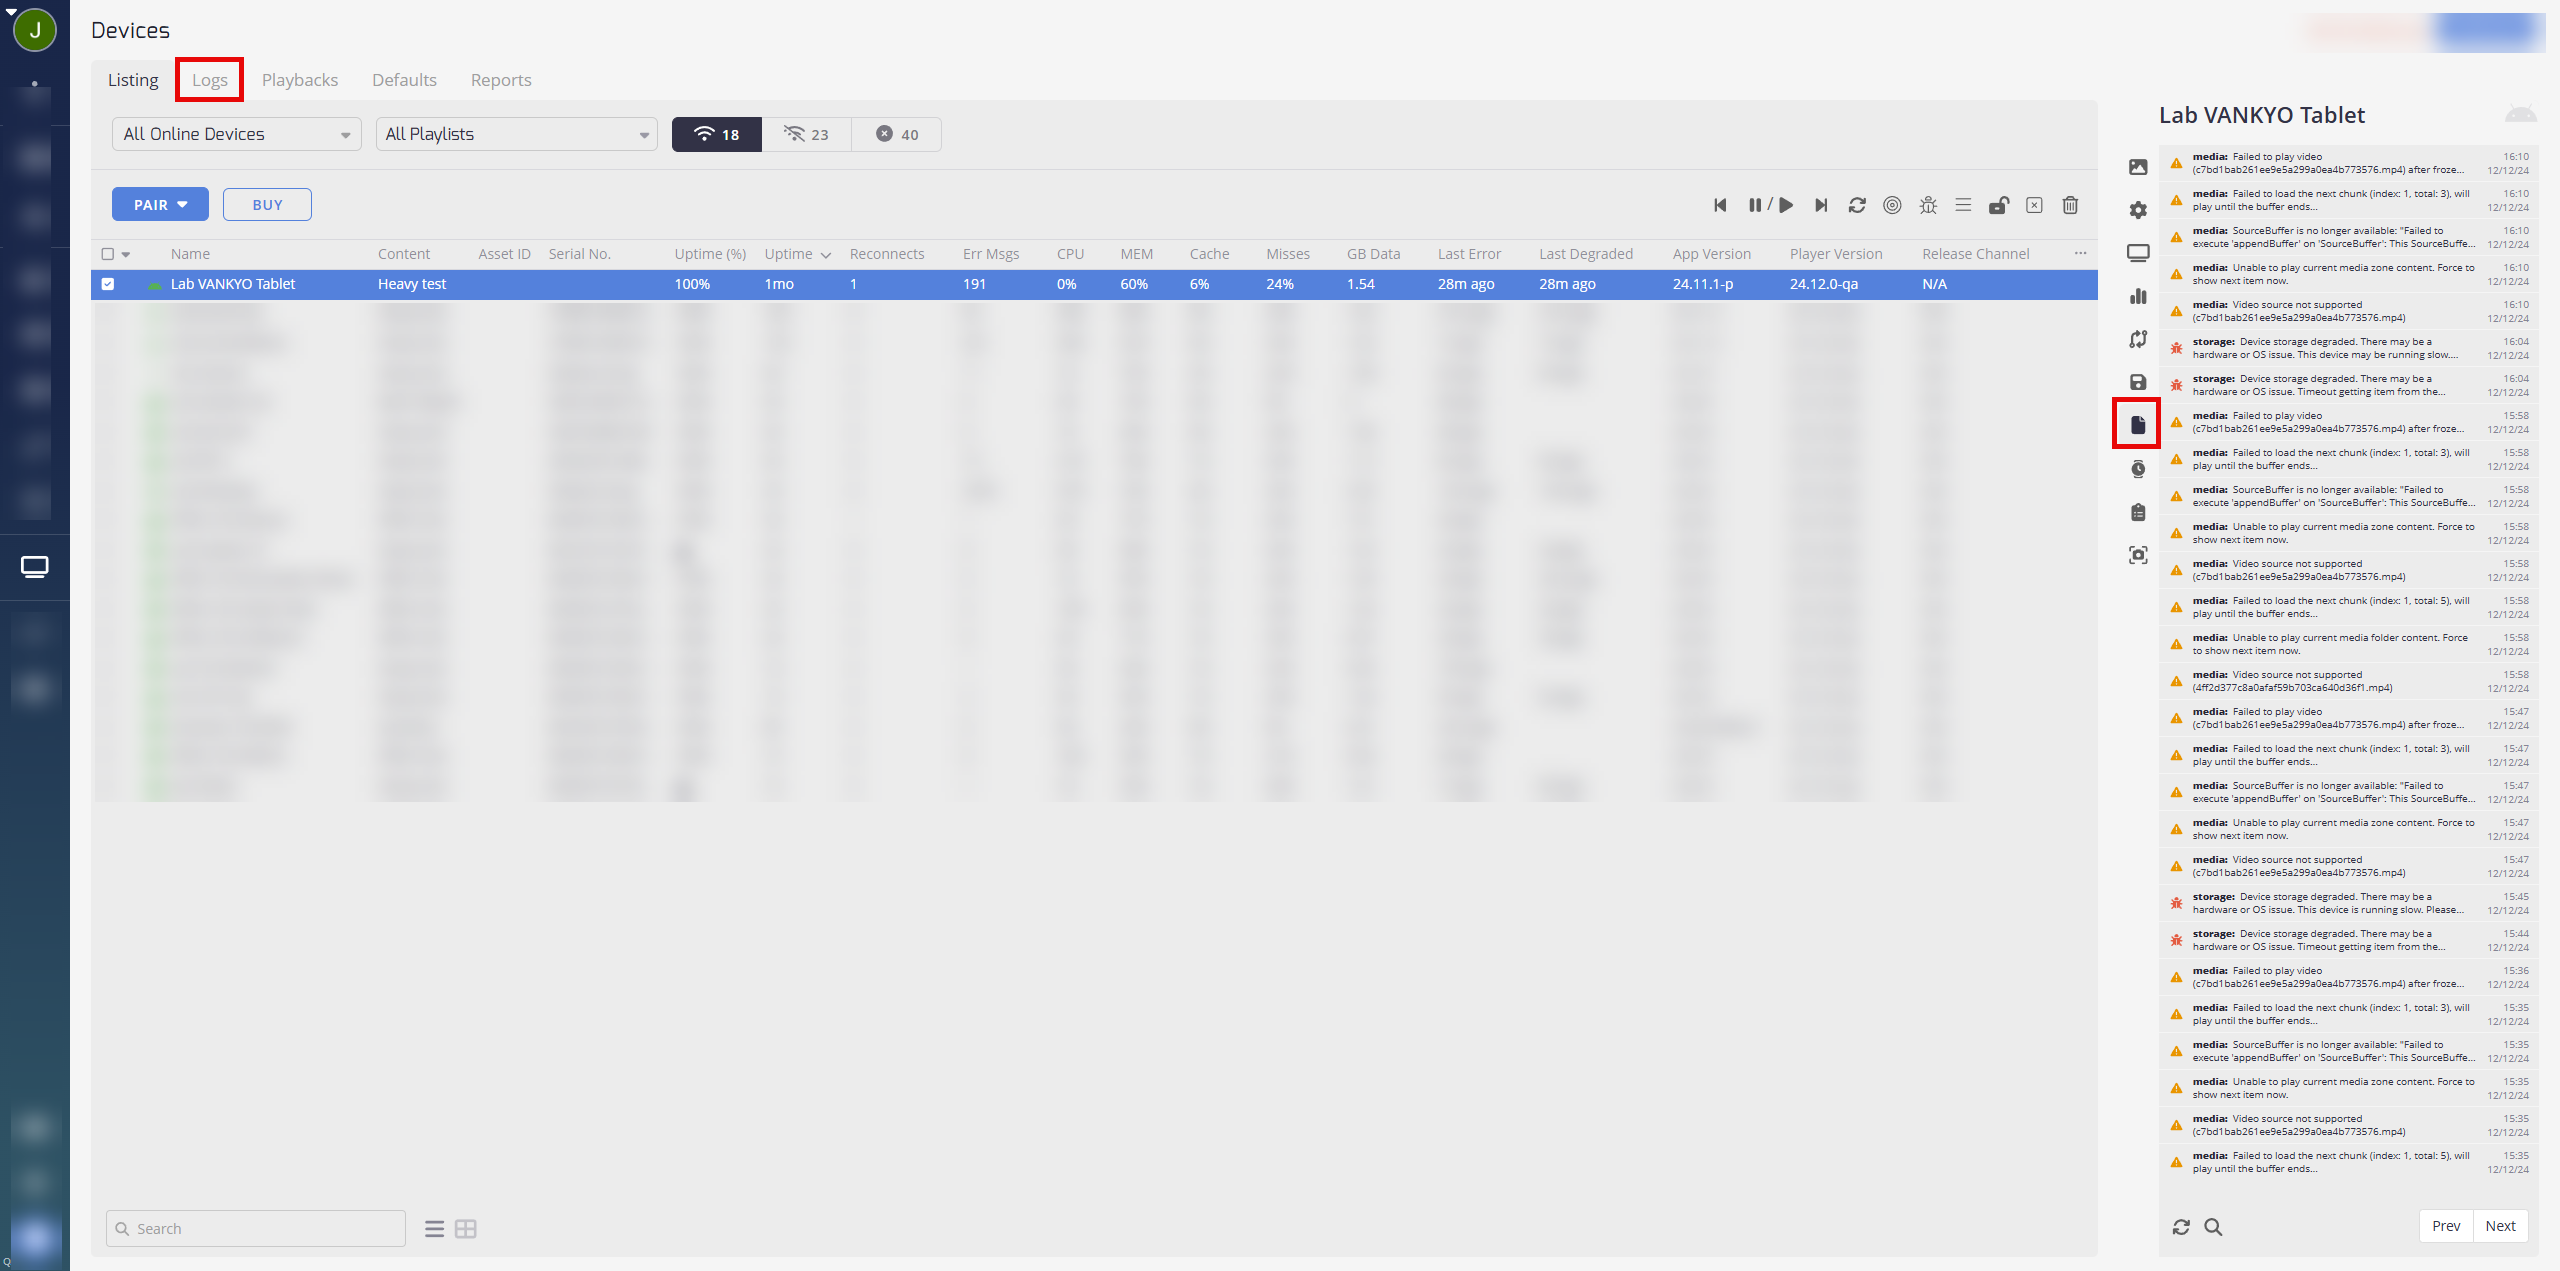
You can click on individual log entries to see more details about the event:
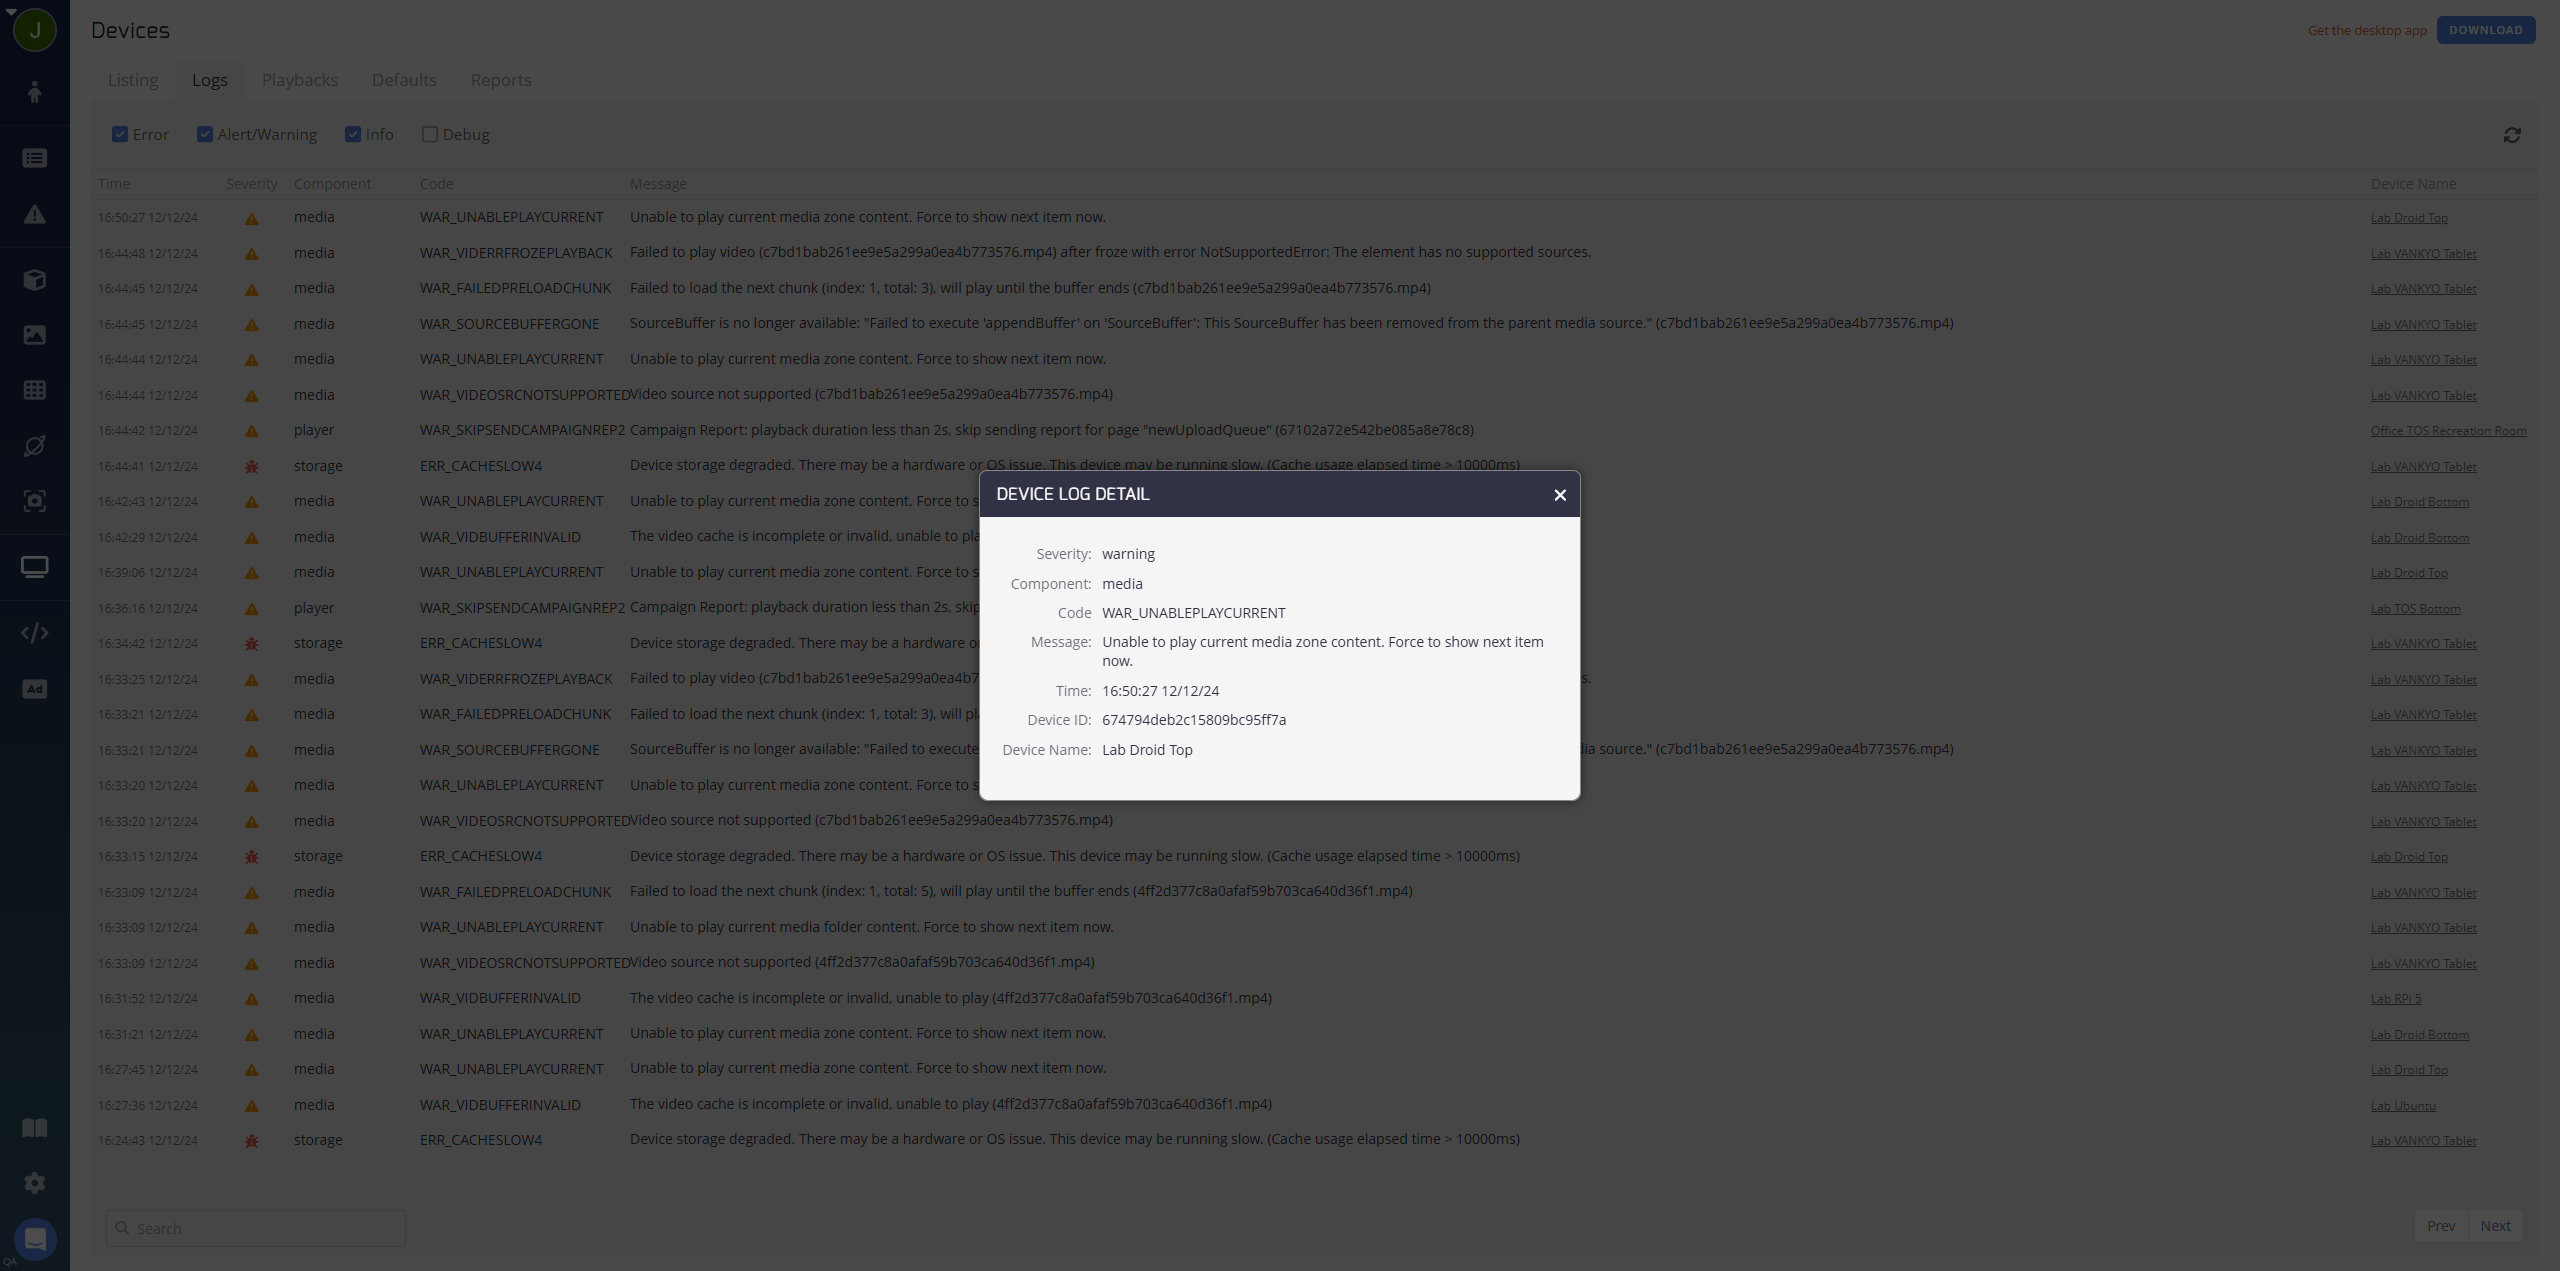
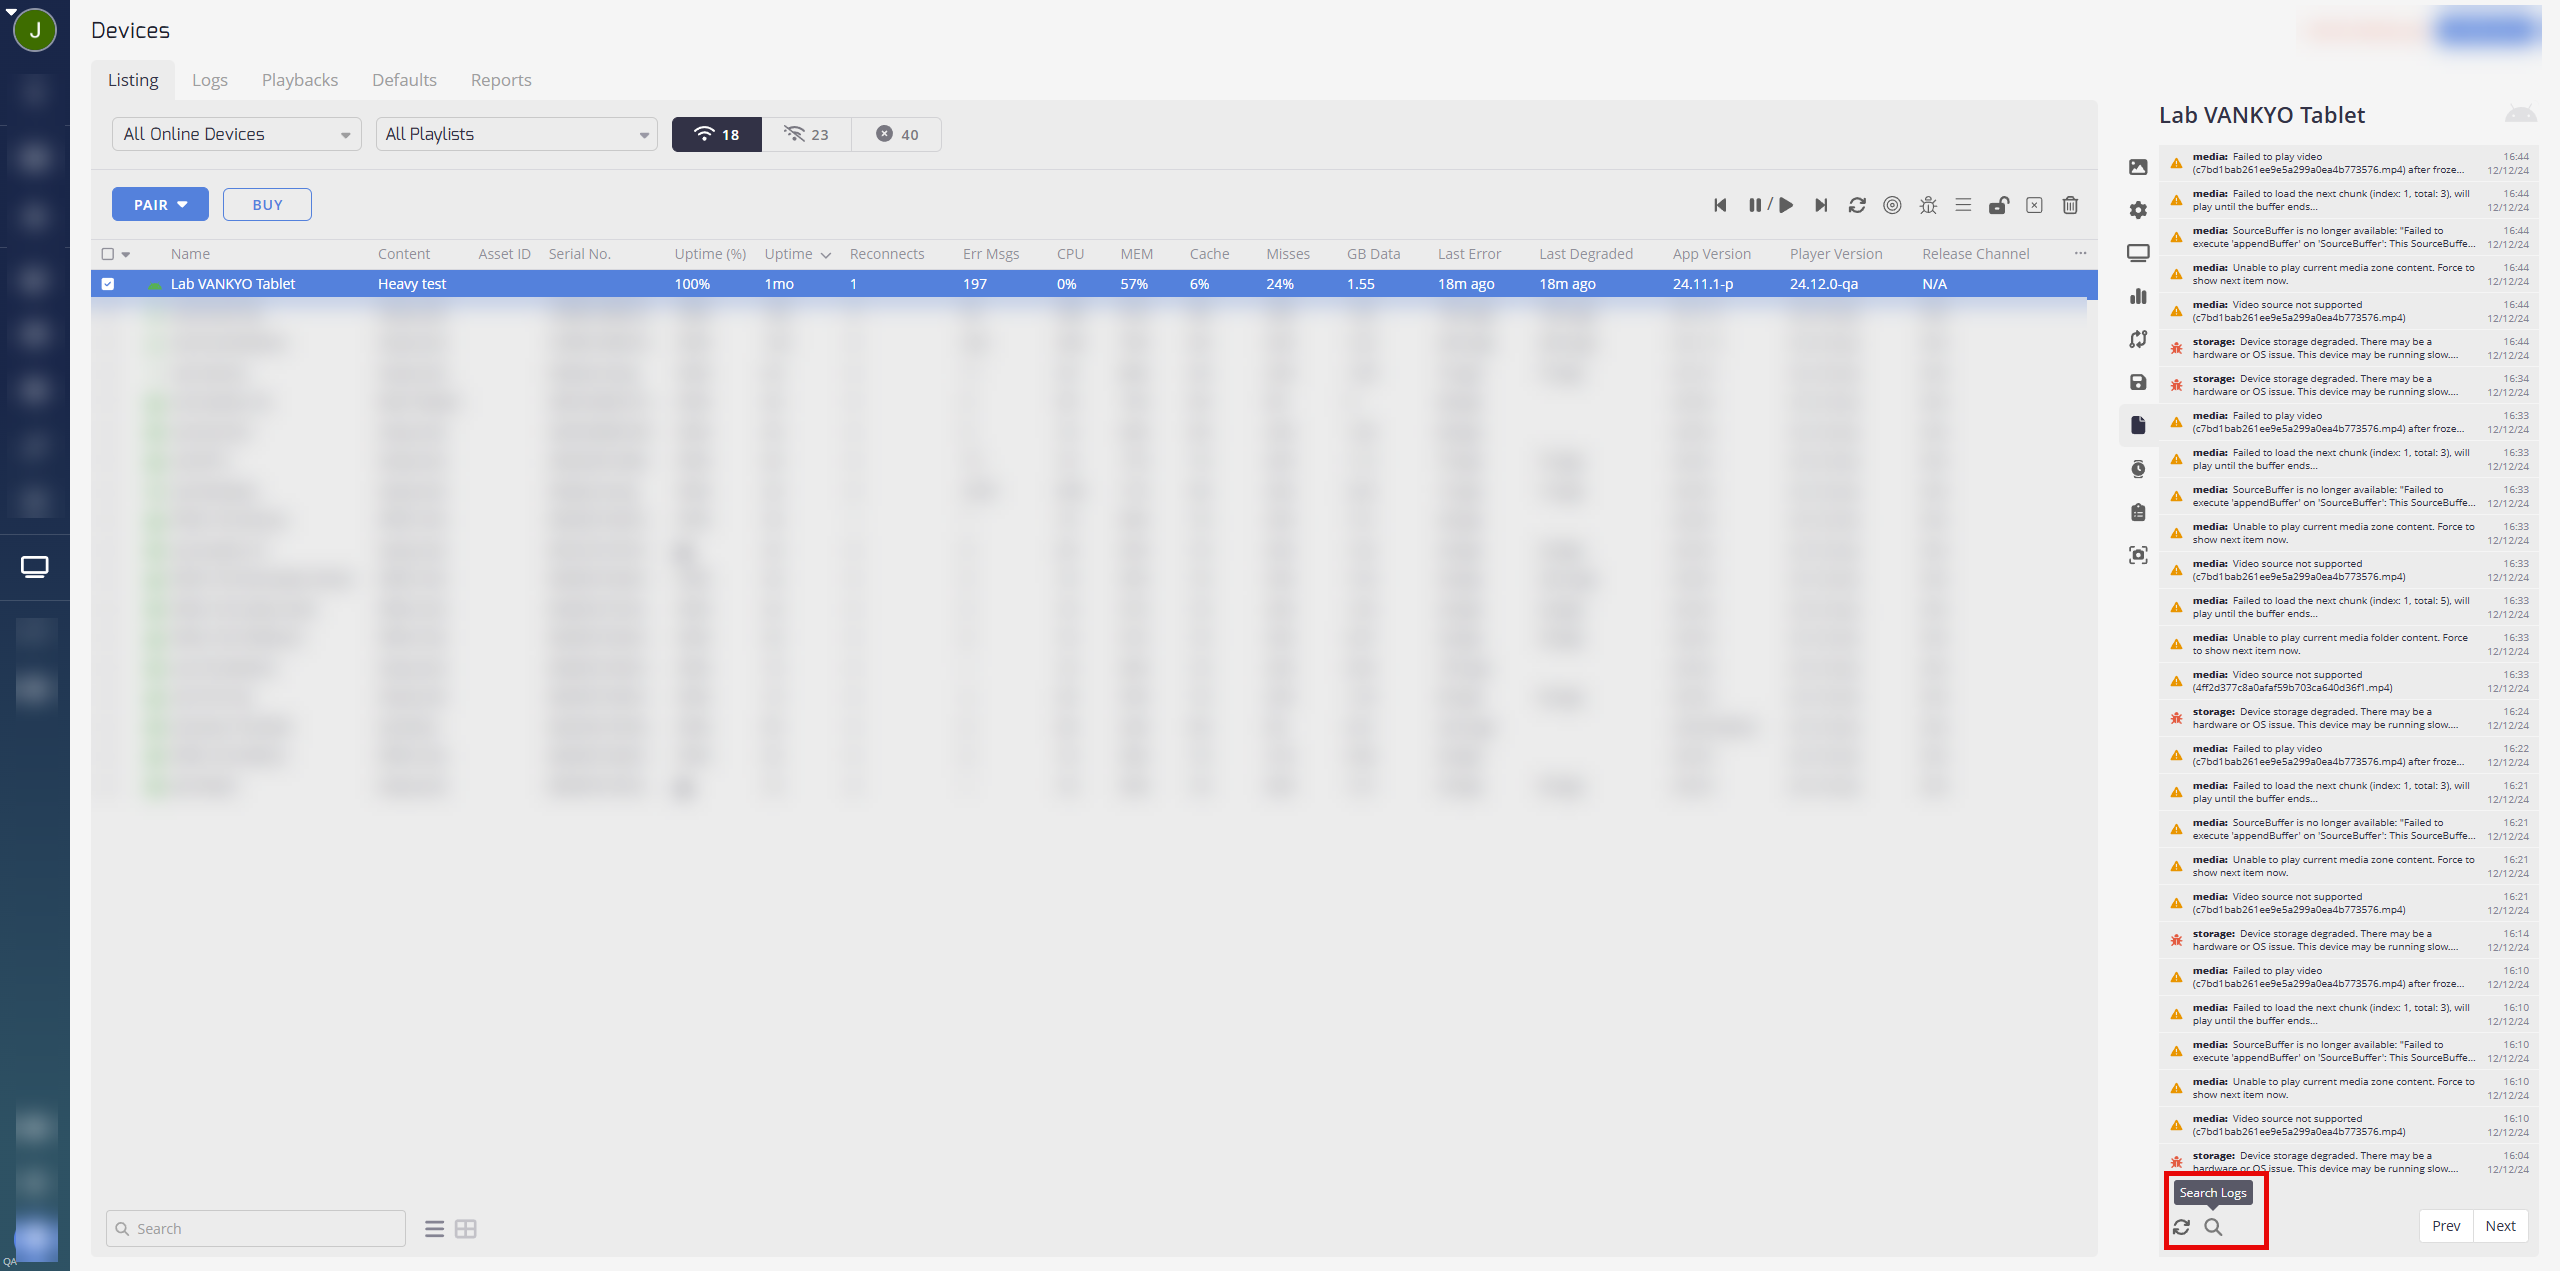
The Severity will correspond to one of the four log categories described above; Debug, Info, Alert/Warning, and Error. Logs can be searched on the basis of these categories using the search magnifying glass on the lower left:
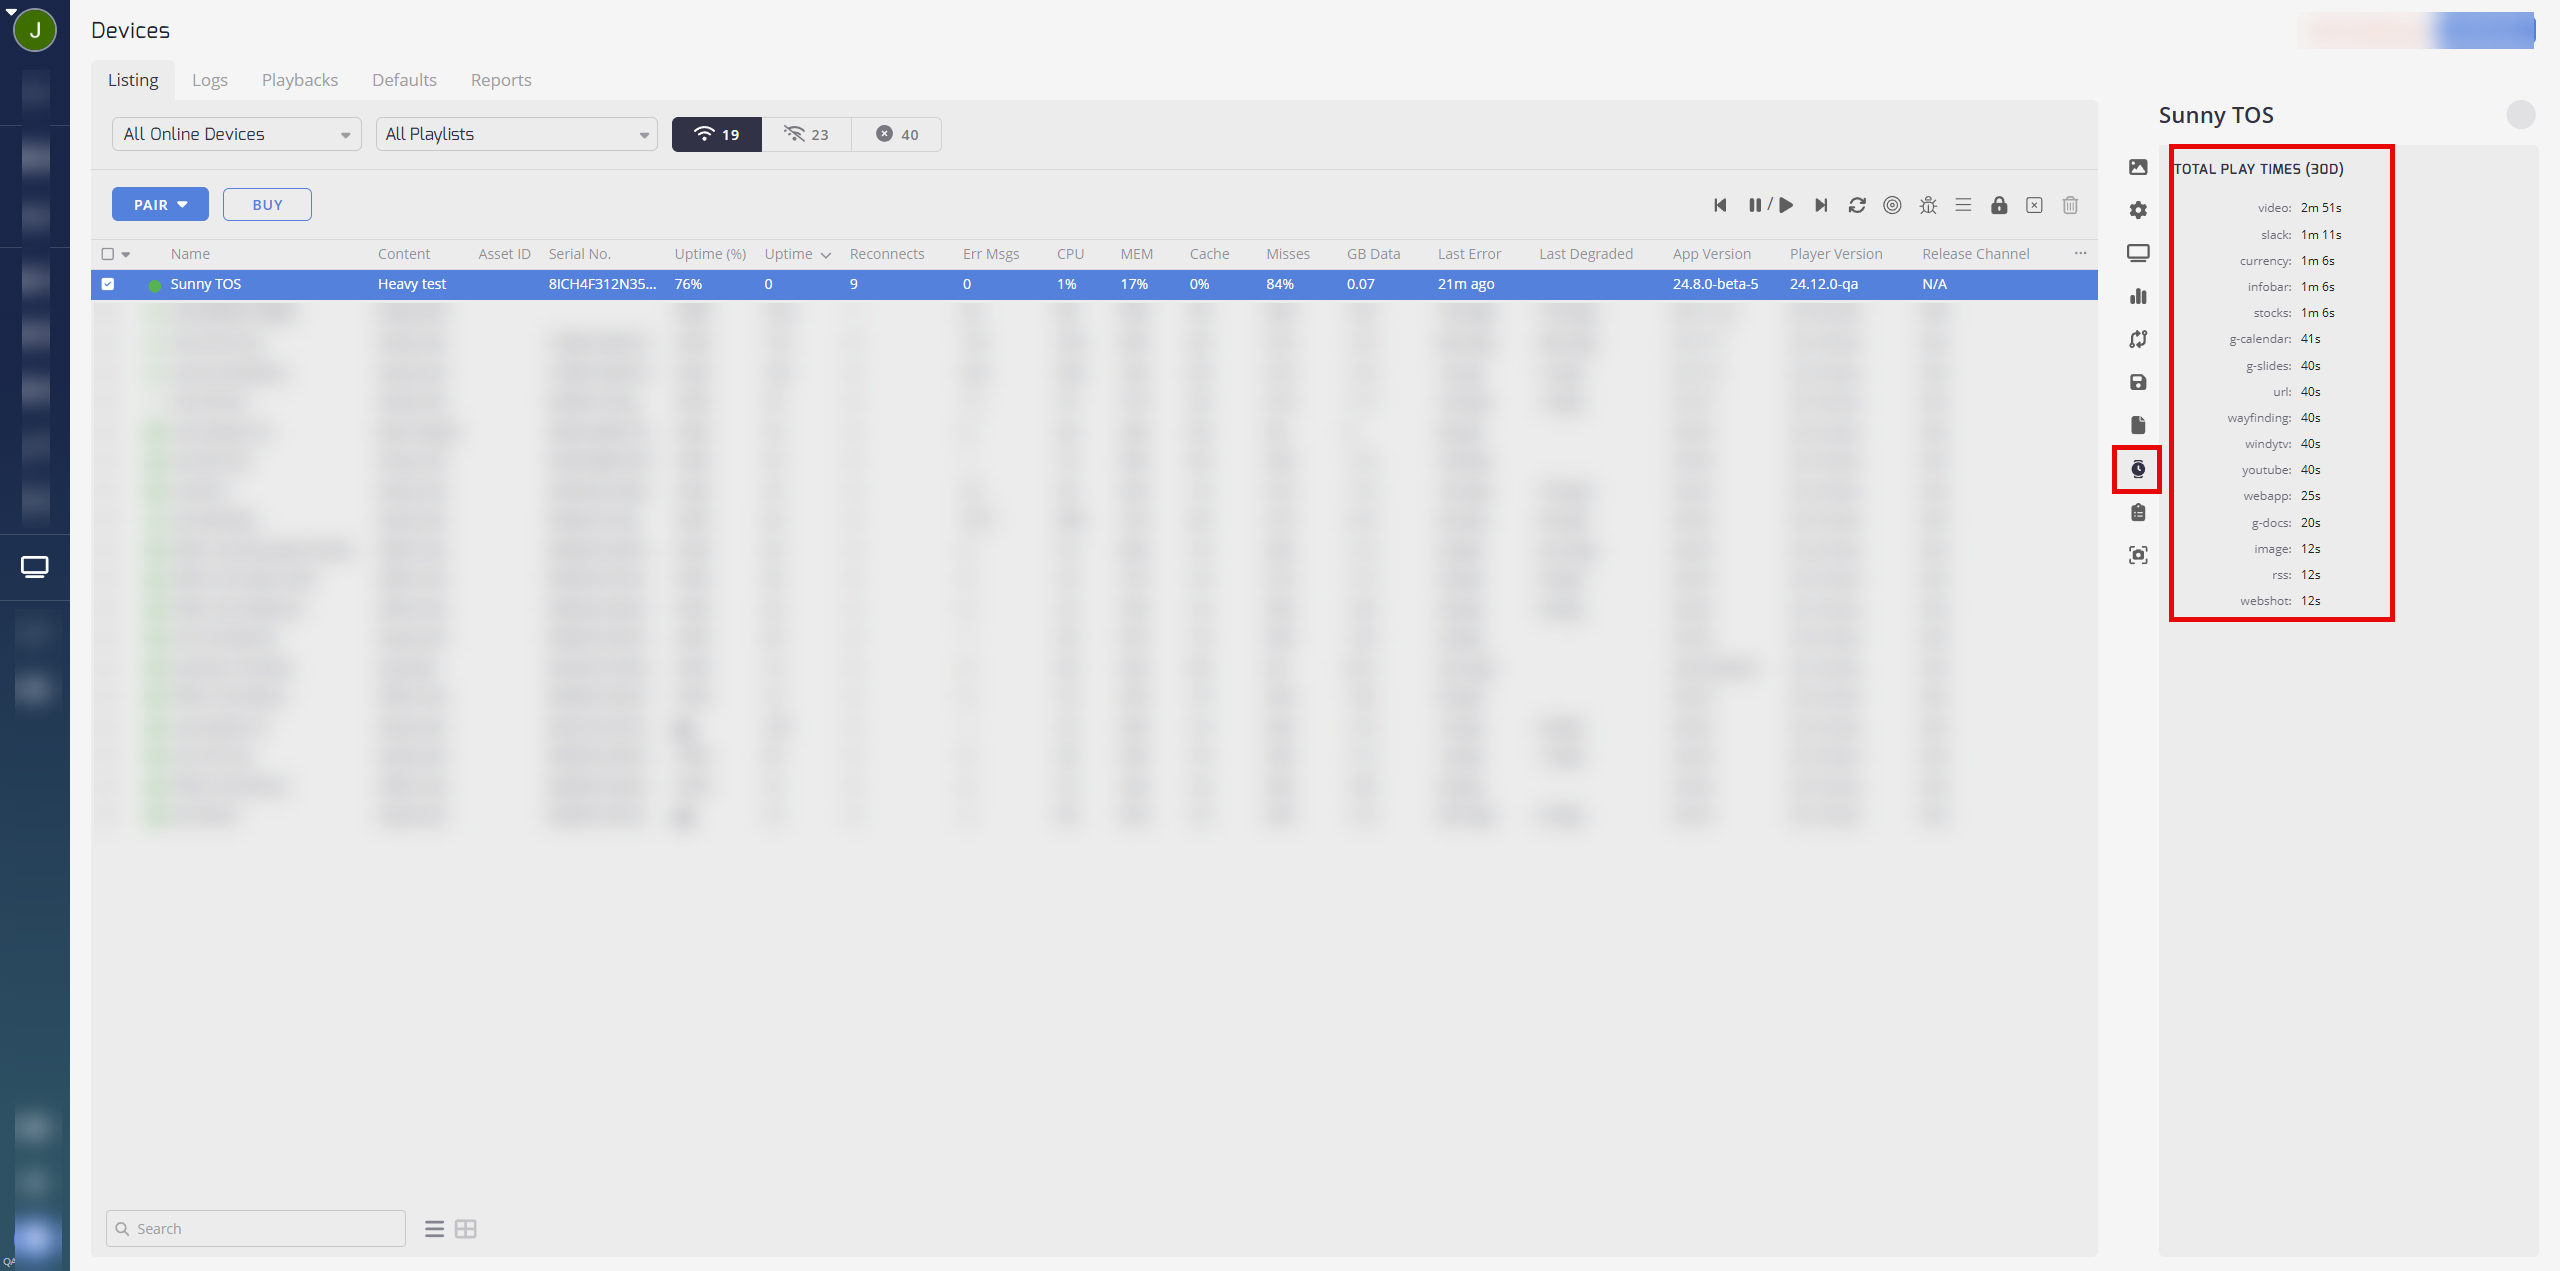
Playtimes
This menu option displays the Total Play Times in days, hours, minutes, and seconds.
Depending on the device, it lists out play times from apps, video, image, and web screenshots.
Playbacks
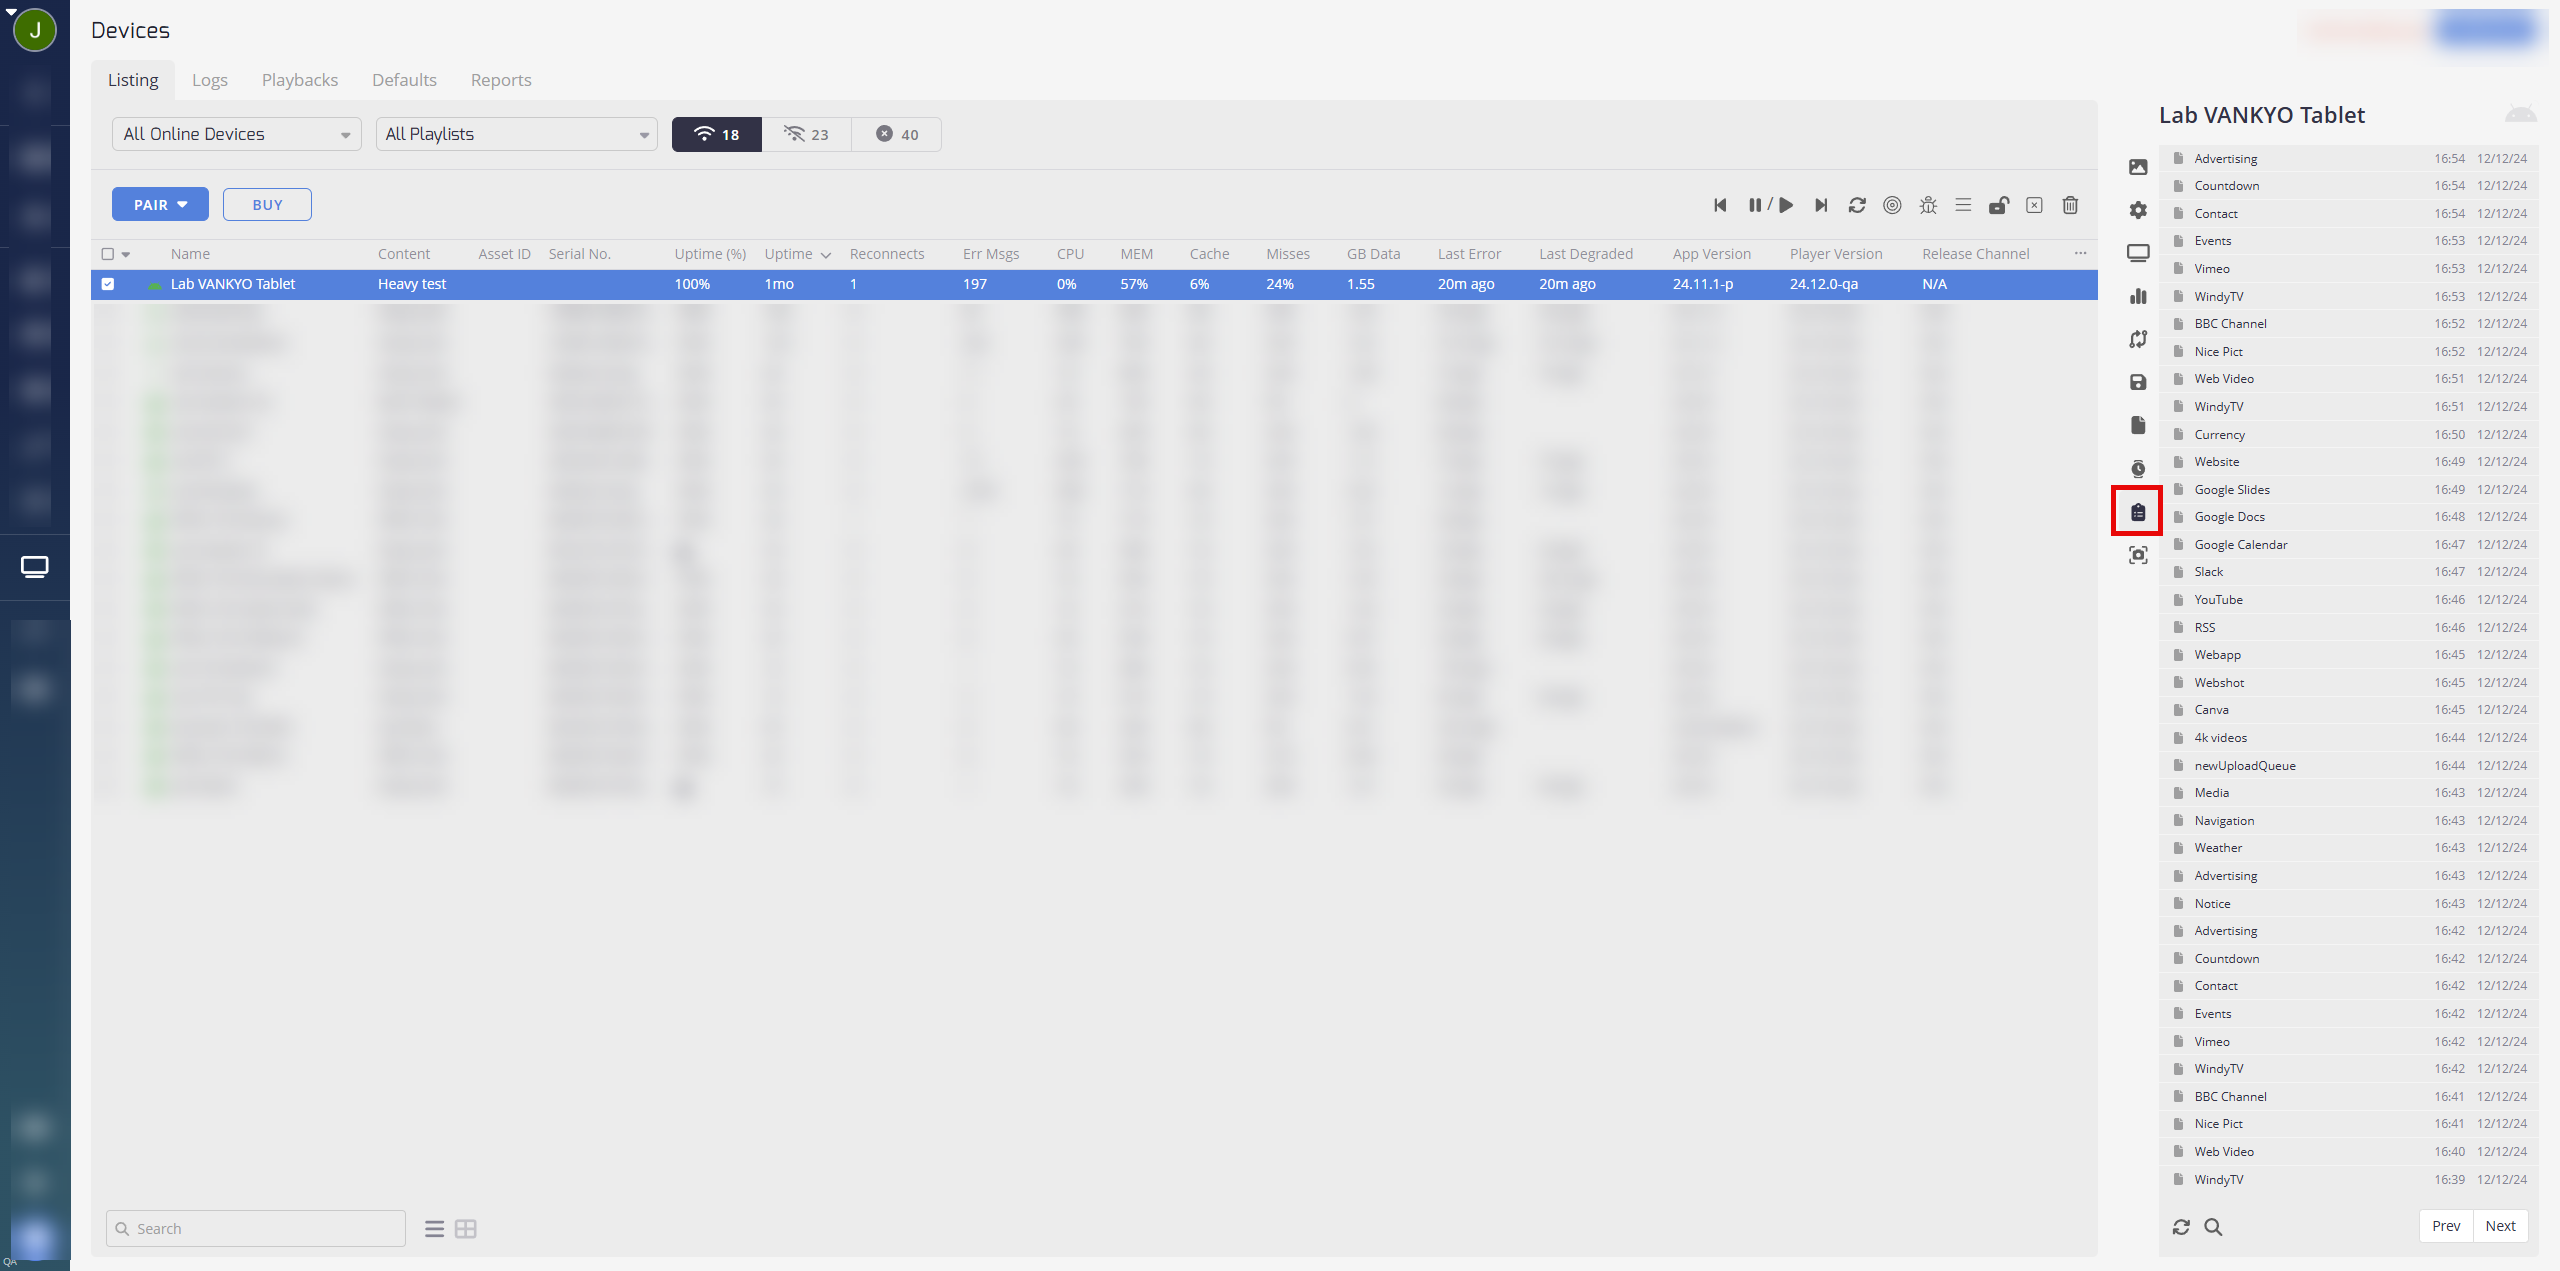
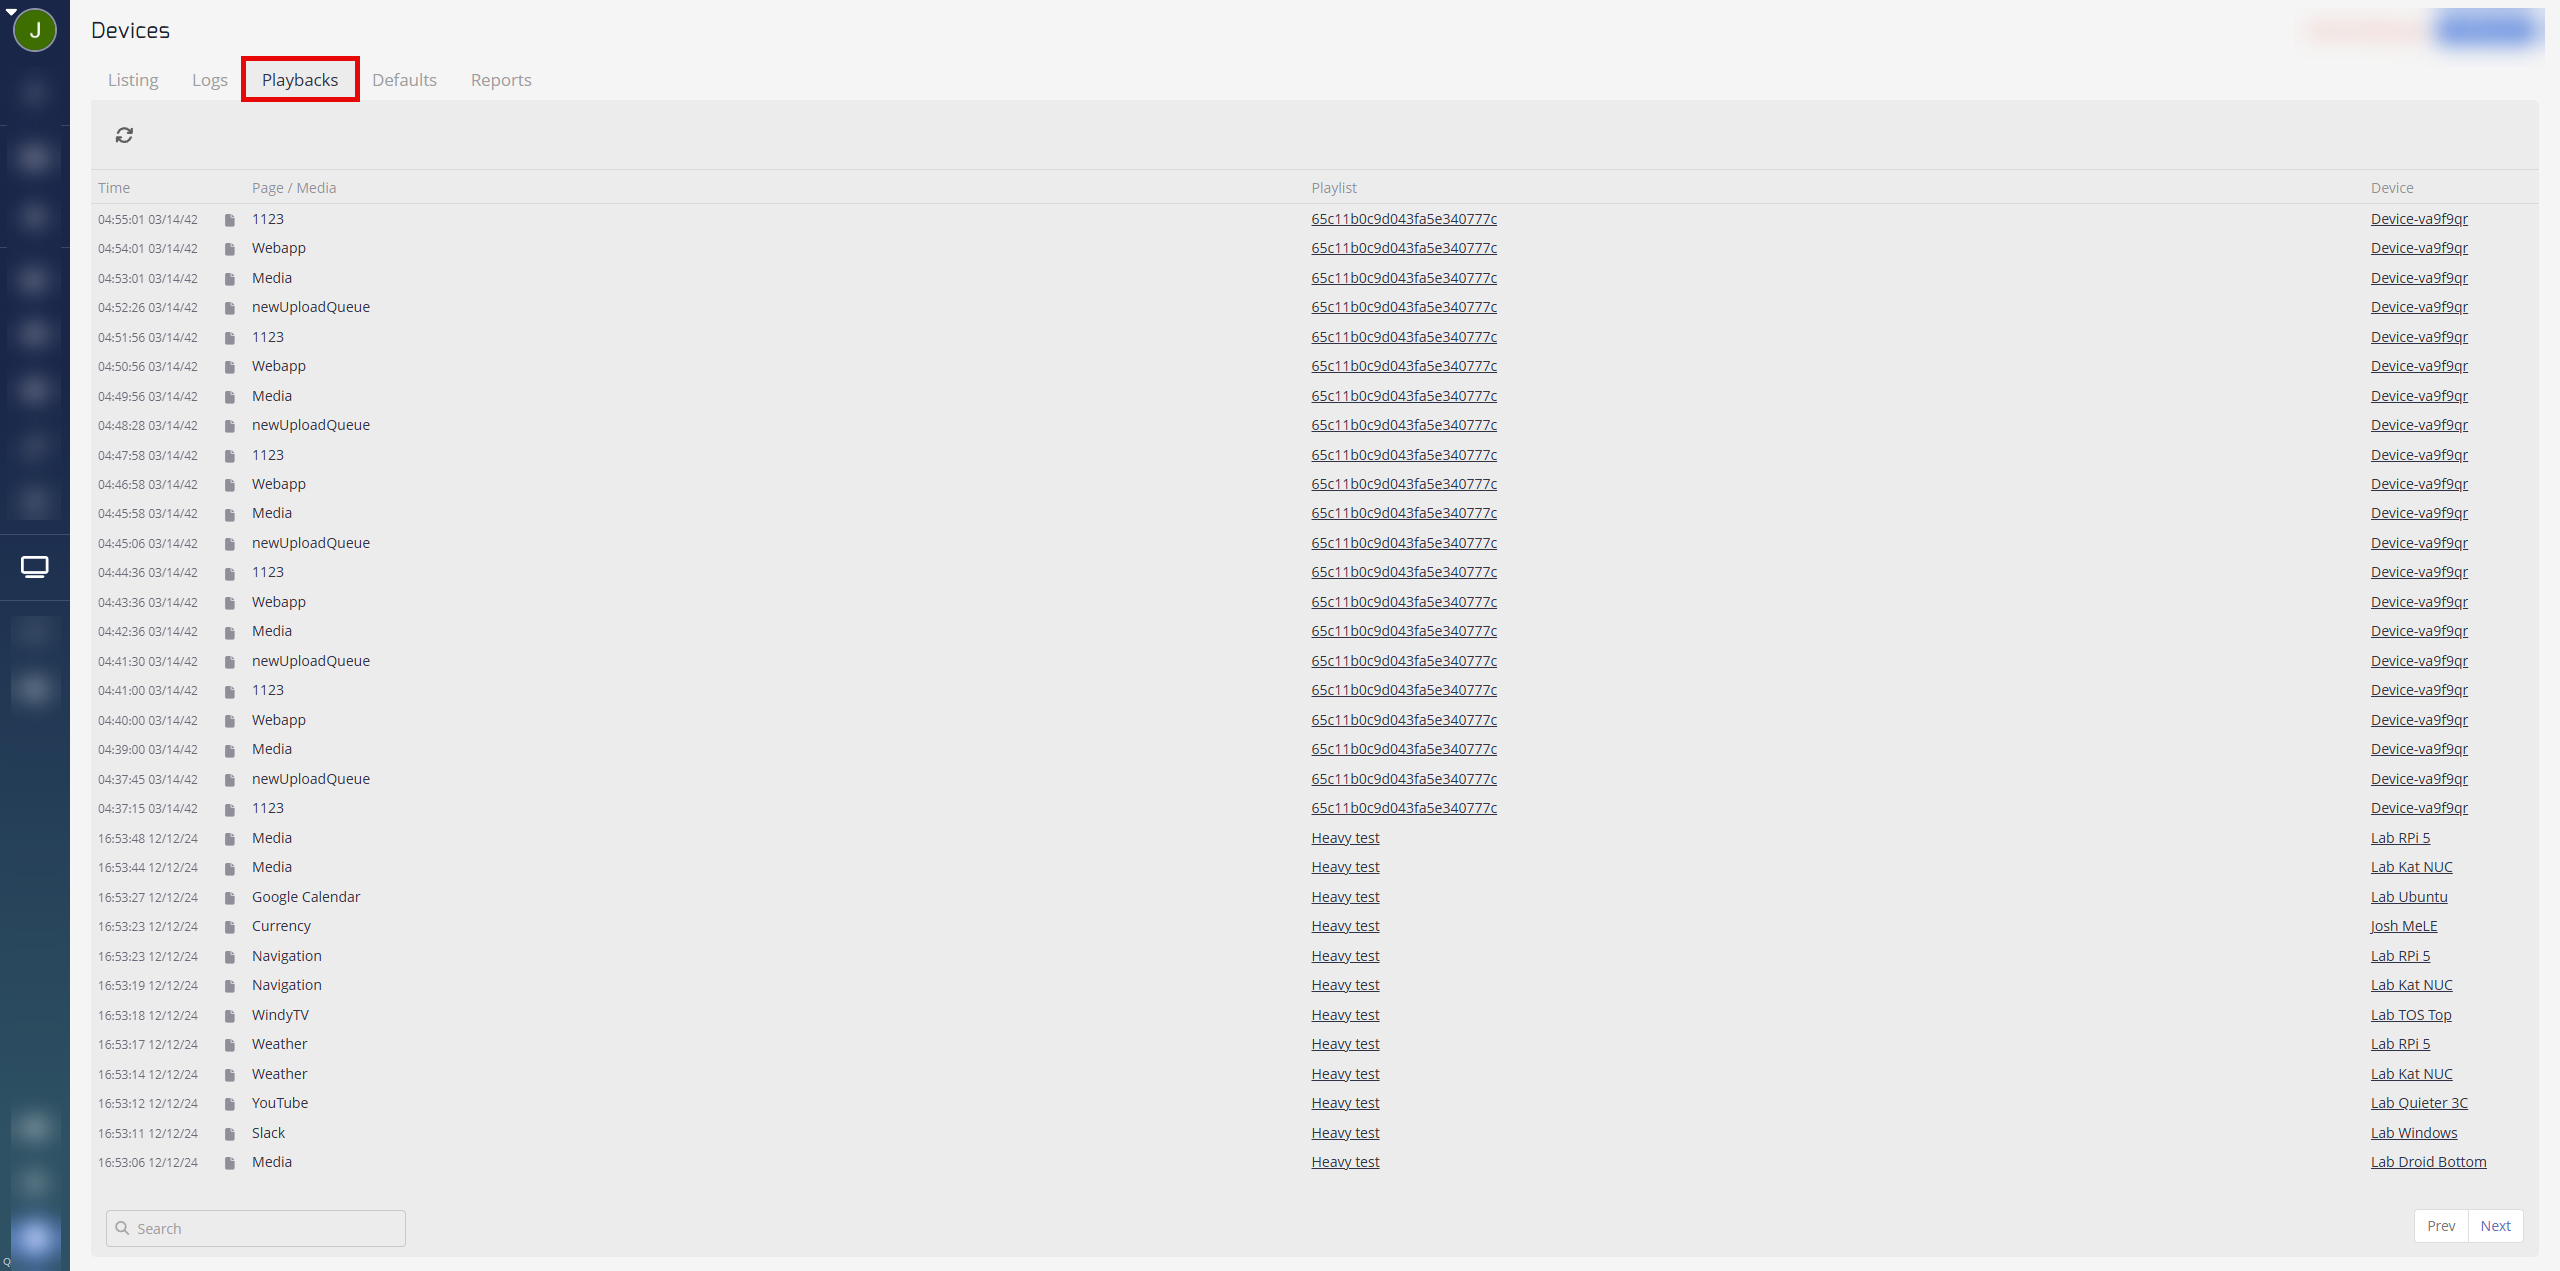
From the Playbacks menu, you can see a record of when each piece of content has been successfully played on the device, as well as the playlist it's a part of.
Playback log entries stay saved in our database for 30 days.
Playback Menu Option
Playback Tab
You can also see logs and playbacks for all your devices together by selecting the Logs or Playbacks tab at the top of the devices page.
Screenshot
This menu option displays a live screenshot of the current device. It shows what is playing currently on the device.
Monitoring Issues With Devices
The devices table is an essential tool for monitoring the health of your devices. By default, the table displays basic information about each device, such as: device name, serial number, reconnects, etc.
Updates in TelemetryTV 23.3.6 to the table have added Last Error and Last Degraded Storage options, which can provide better visibility over issues with your devices. Sorting devices by these columns can help you quickly identify and address any issues that arise.
To find the Last Error and Last Degraded Storage, first go into your devices page in your TTV account. Then click on the the tab as shown below.

Next, scroll down the list until you find Last Error and Last Degraded and toggle them on.
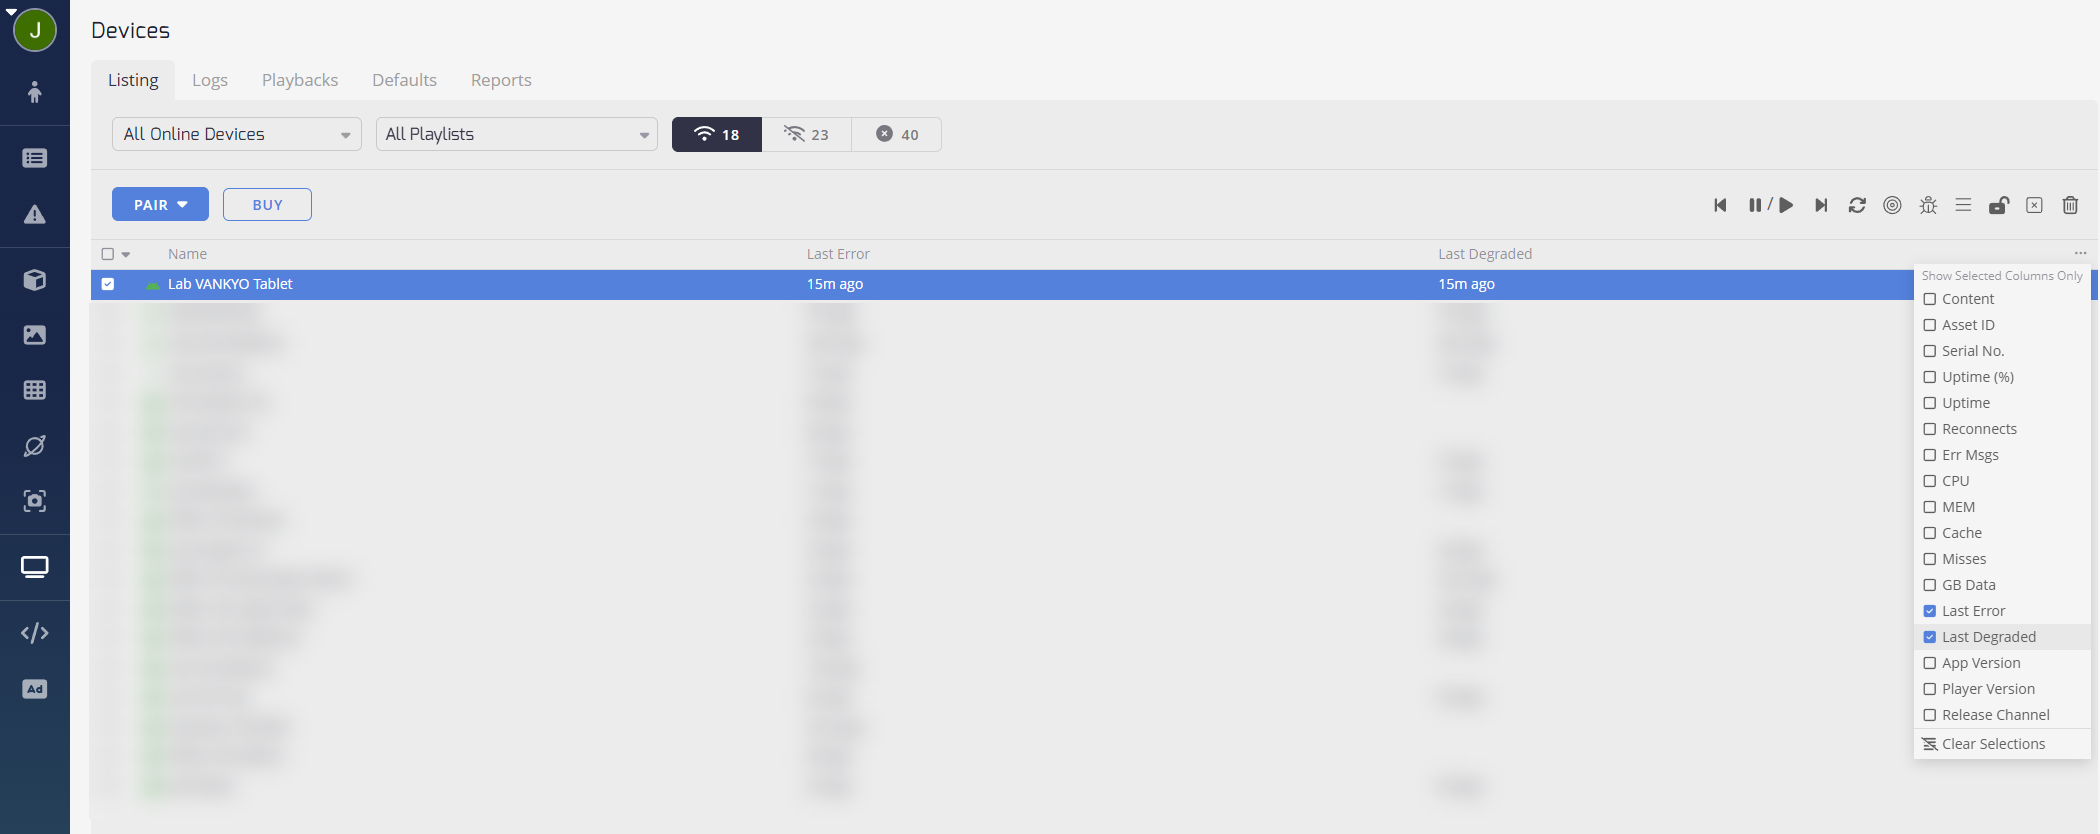
They will now be available as shown below.
The Last Error column displays the timestamp of the last error log related to a particular device, while the Last Degraded column displays the timestamp of the last error log related to storage issues with a particular device.
Sorting the devices by these columns can help you quickly identify which devices have had recent issues and need attention. Additionally, the player and app version columns display the version numbers of the player and app running on each device, which can be helpful when diagnosing version-specific issues with your devices.
By utilizing the devices table's features, you can effectively monitor the health of your devices and address any issues promptly. If you have any further questions or issues with the devices table, please contact our support team for assistance.
Updated 5 months ago